
Fig. 6.
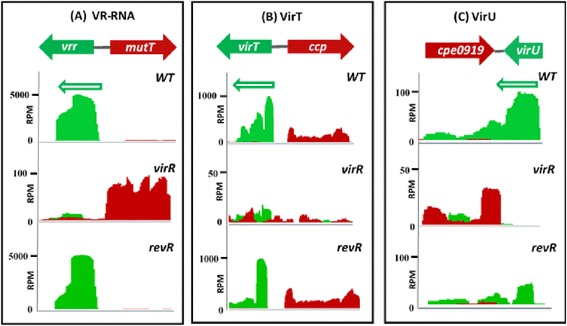
Expression levels and depth of coverage plots of VR-RNA, VirT and VirU. Depth of coverage plots of a VR-RNA (cpe0957), b VirT (cpe0845) and c VirU (cpe0920) in the wild-type strain, and the virR and revR mutants are shown as visualized in Artemis. The genetic organization of each sRNA is shown on the top of each figure. Mapped RNA-seq data are displayed as a plot showing sequence depth for the forward (red) and reverse (green) strand. In the depth of coverage plots, the Y axes represent the coverage depth in reads per million mapped reads (RPM). Expressed sRNAs are clearly seen as peaks in the depth of coverage plots