
Fig. 4.
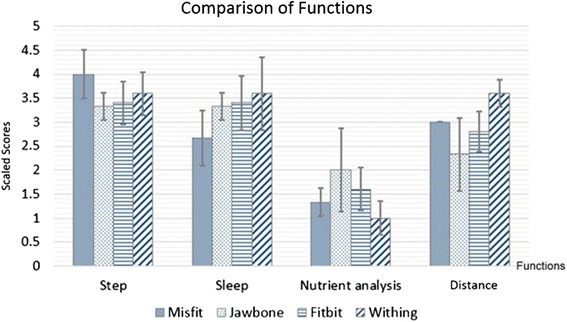
Bar graph comparing mean and standard deviation of the function satisfaction scores given by subjects when using the devices
Official websites use .gov
A
.gov website belongs to an official
government organization in the United States.
Secure .gov websites use HTTPS
A lock (
) or https:// means you've safely
connected to the .gov website. Share sensitive
information only on official, secure websites.
Bar graph comparing mean and standard deviation of the function satisfaction scores given by subjects when using the devices