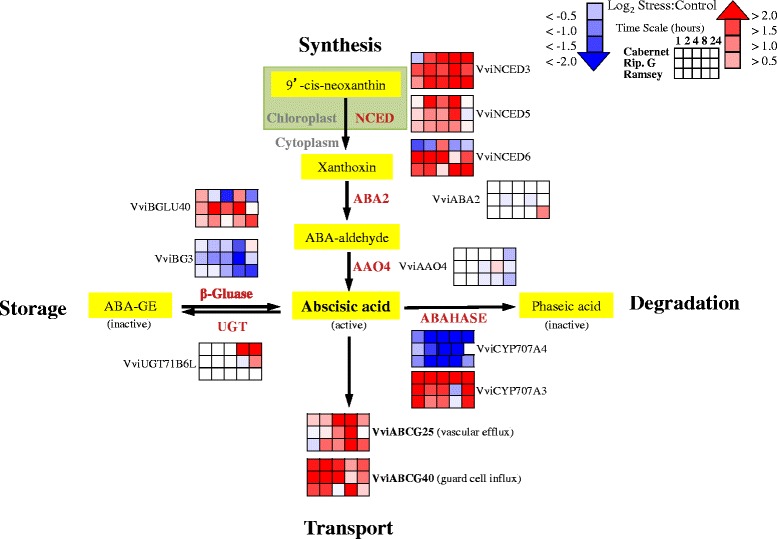
Fig. 1.

A simplified model of transcripts involved in ABA metabolism and transport. Corresponding Vitis loci ID and ANOVA results for the gene symbols used in this figure are listed in Additional file 6. Data are presented as heatmaps of mean values of a log2 ratio (Stress:Control), n = 3 at each time point
