Fig. 8.

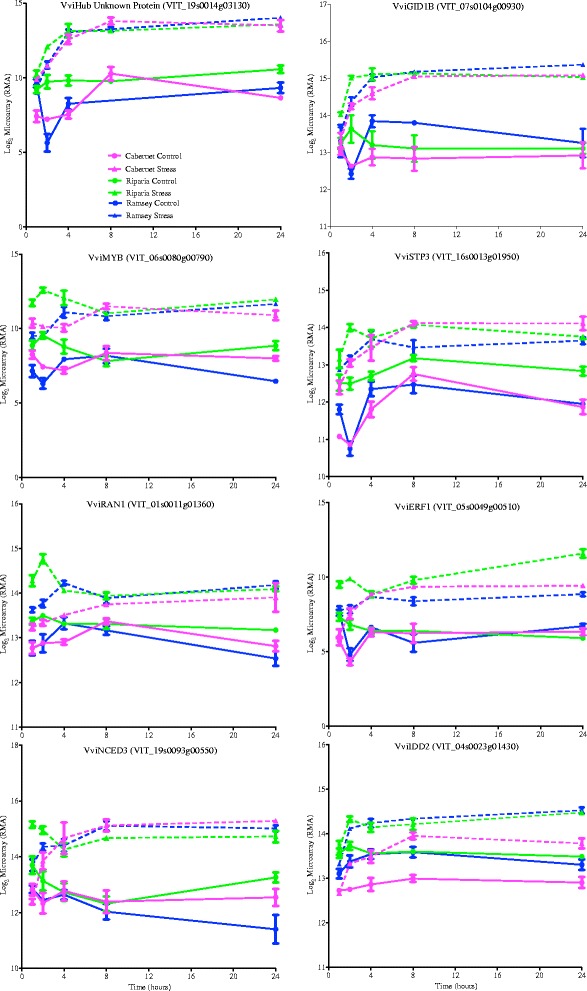
Transcript abundance of some of the top gene hubs in the lightsteelblue module. Expression values are presented as the mean ± SE log2 values, n = 3 at each time point

Transcript abundance of some of the top gene hubs in the lightsteelblue module. Expression values are presented as the mean ± SE log2 values, n = 3 at each time point