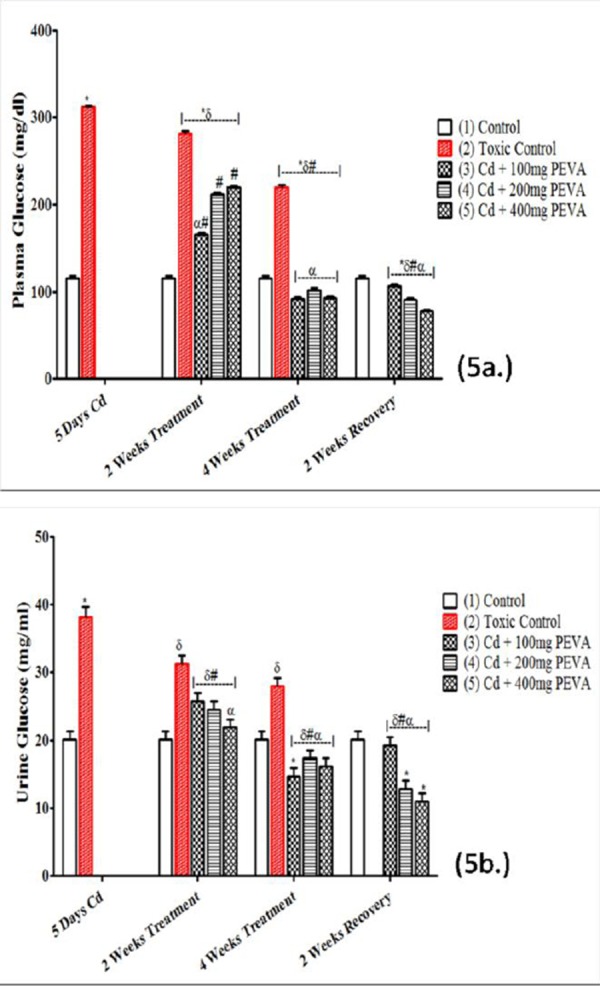
Figure 5.

Effects of PEVA on plasma glucose (a.) and urine glucose (b.) of rats with Cd-induced kidney injury. Each value represents mean ± S.E.M (n = 5); *= significantly different from control (p < 0.05); δ= significantly different from toxic group (p < 0.05); #= significantly different from 2 weeks toxic recovery group (p < 0.05); α= significantly different from 4 weeks toxic recovery group (p < 0.05).
