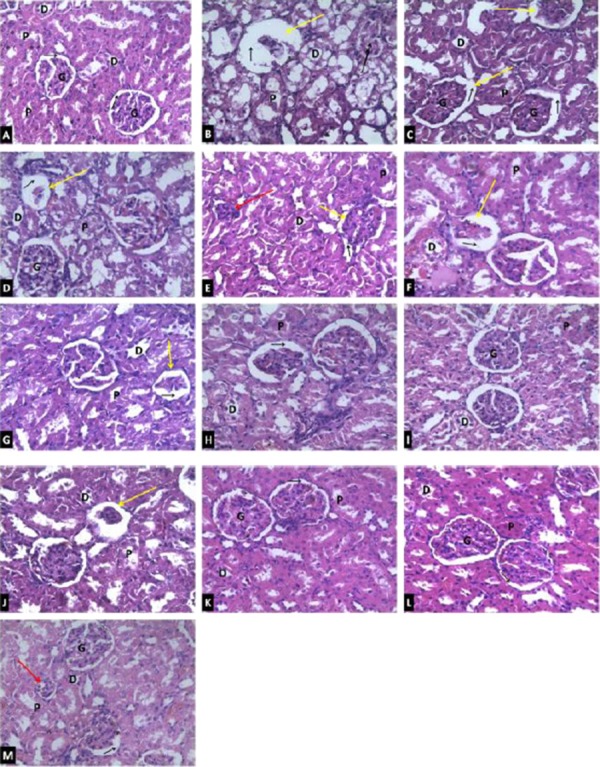
Figure 7.

Photomicrographs of renal tissues showing the effects of PEVA treatment following Cd-induced kidney injury in rats (Magnification 400x). A = Control group; B = Toxic group (5 days Cd treatment); C = Toxic group (Cd + 2 weeks recovery period); D = Toxic group (Cd + 4 weeks recovery period); E = Cd + 100 mg/kg PEVA for 2 weeks; F = Cd + 200 mg/kg PEVA for 2 weeks; G = Cd + 400 mg/kg PEVA for 2 weeks; H = Cd + 100 mg/kg PEVA for 4 weeks; I = Cd + 200 mg/kg PEVA for 4 weeks; J = Cd + 400 mg/kg PEVA for 4 weeks; K = 100 mg/kg PEVA treatment + 2 weeks recovery period; L = 200 mg/kg PEVA treatment + 2 weeks recovery period; M = 400 mg/kg PEVA treatment + 2 weeks recovery period; Yellow arrow = atrophic glomerulus; Red arrow = shrunken glomerulus; Black single arrow = Bowman’s capsular space; Black double arrow = Severe cloudy swelling of the proximal convoluted tubule; G = Glomerulus; P = Proximal convoluted tubules and D = Distal convoluted tubules.
