. 2015 Sep 30;3(4):607–612. doi: 10.3889/oamjms.2015.103
Copyright: © 2015 Gordana Kamceva, Marija Vavlukis, Darko Kitanoski, Sashko Kedev.
This is an open access article distributed under the terms of the Creative Commons Attribution License, which permits unrestricted use, distribution, and reproduction in any medium, provided the original author and source are credited.
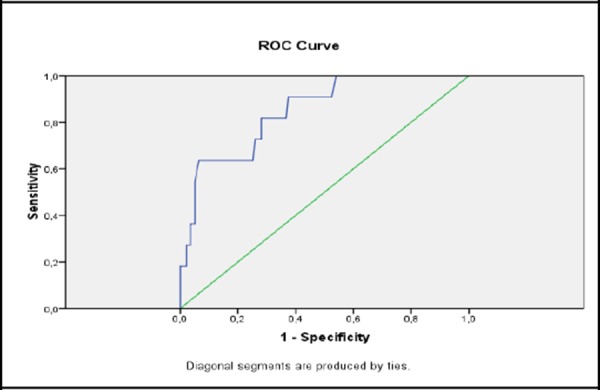
Figure 4.

Prediction of CD with stress glycaemia (ROC curve).
