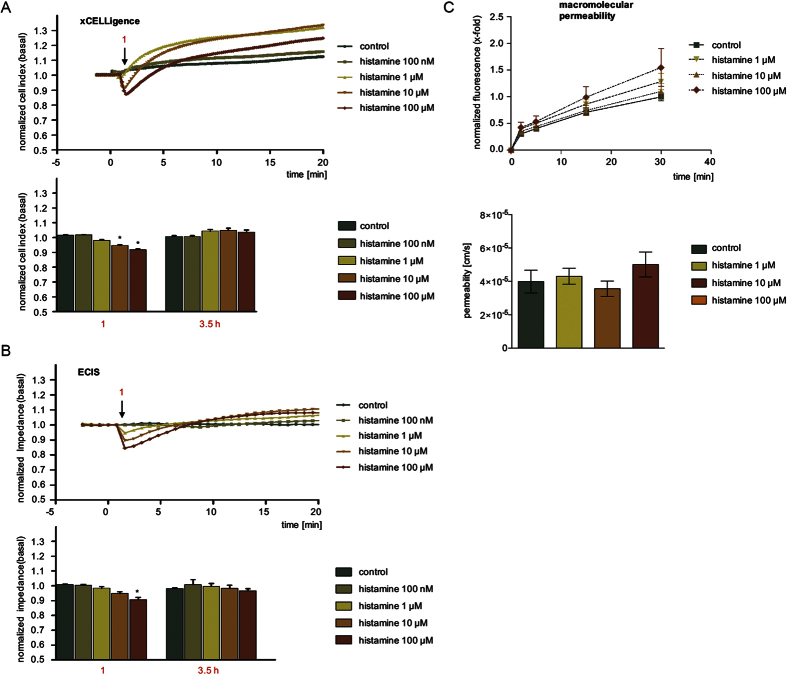
Figure 1. Histamine-induced endothelial hyperpermeability was determined more reliably by impedance measurements.
HMECs were treated with increasing concentrations of histamine as indicated. Representative experiments show time resolved changes in normalized CI (A) or normalized impedance values (B). The bar graphs show the normalized CI (A) or impedance levels (B) of two time points for all experiments performed here (arrow 1: maximum effect of histamine). (C) Macromolecular permeability of FITC-dextran (40 kDa) across an HMEC cell layer was measured with a Transwell® two-compartment system. Samples were taken from the lower compartment at indicated time points. The results are depicted as normalized FITC-dextran concentrations or as absolute permeability (reference time point was 30 min in each case). At least three independent experiments were performed. Data are expressed as mean ± SEM. *P ≤ 0.05 (one-way ANOVA followed by Newman-Keuls post-hoc test).

