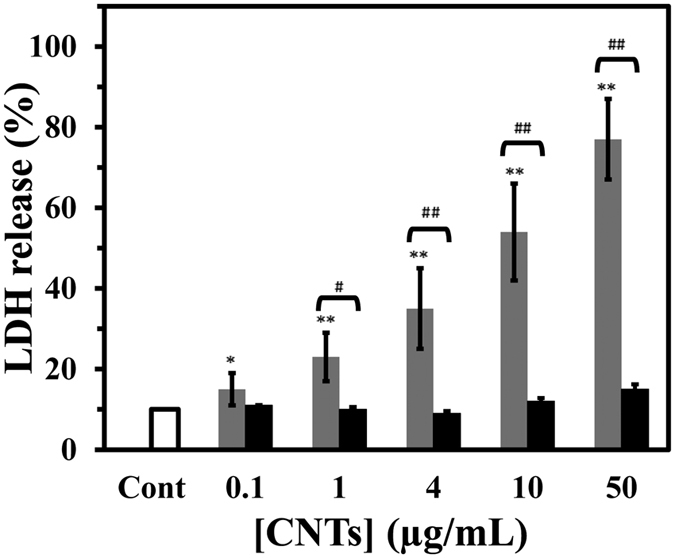
Figure 10. Effect of raising concentration of SWCNT and MWCNT on LDH release of PC12 cell.

Cells were treated with raising concentration of SWCNT (black) or MWCNT (gray) for 48 h at 37 °C. The percentage of cell viability was calculated by the LDH assay as explained in materials and methods. Data are shown as average of three separate experiments and error bars represent standard deviation (SD). *P < 0.05 and **P < 0.01 represents the significant differences between CNTs –treated groups and control. #P < 0.05 and ##P < 0.01 represents the significant differences between MWCNT –treated groups and SWCNT –treated groups.
