
Fig. 10.
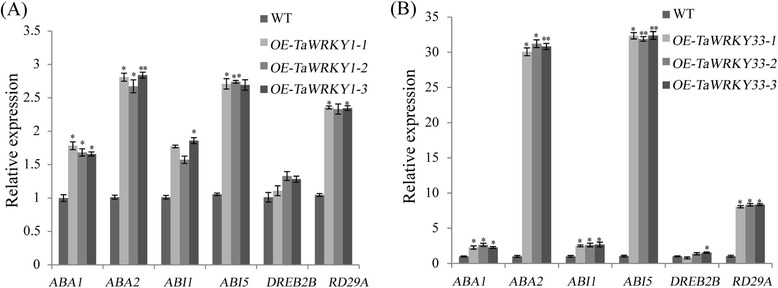
Expression levels of stress-responsive genes under regulation of TaWRKY1 (a) and TaWRKY33 (b). The vertical ordinates are fold changes, and the horizontal coordinates are gene names. Data are means ± SD of three independent experiments and * above the error bars or different letters above the columns indicate significant differences at p <0.05