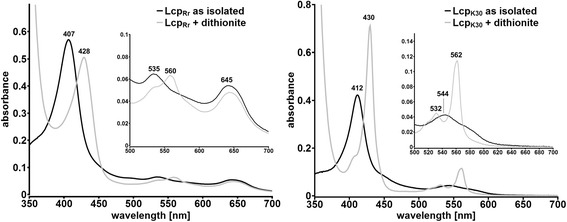
Fig. 6.

UVvis spectrum of LcpRr and LcpK30 as isolated (black lines) and after reduction with dithionite (grey lines). Both Lcp proteins show a prominent band at 407 (412 nm in case of LcpK30) that is characteristic for porphyrines. After reduction with dithionite a characteristic shift of the α-band to 428 (430) nm as well as an increase in the Q-band region (560/562 nm) was observable. Assays were repeated at least three times with two separate protein batches. A typical experiment is shown
