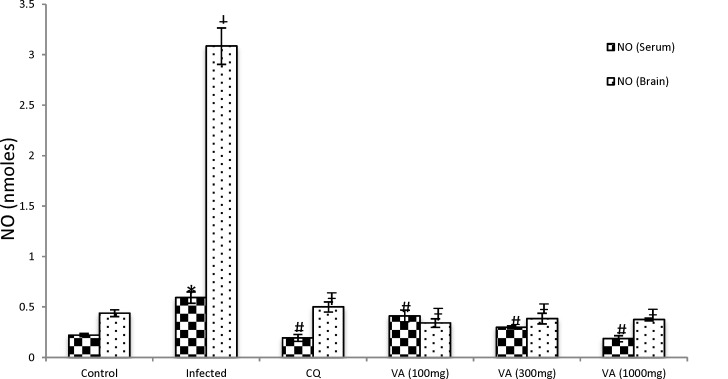
Figure 5.
Effect of ethanol extract of V. amygdalina leaves and chloroquine on nitric oxide level in P. berghei infected mice. Data represent mean ± SEM (n = 6 for each group). CQ = chloroquine treated group; Control (infected) = non-treated infected group; VA (100mg) = V. amygdalina extract (100mg/kg body weight) treated group; VA (300mg) = V. amygdalina extract (300mg/kg body weight) treated group; VA (1000mg) = V. amygdalina extract (1000mg/kg body weight) treated group. = non-treated infected mice treated with the vehicle (carboxylmethyl cellulose); VA (100mg) = V. amygdalina extract (100mg/kg body weight) treated group; VA (300mg) = V. amygdalina extract (300mg/kg body weight) treated group; VA (1000mg) = V. amygdalina extract (1000mg/kg body weight) treated group. * = p<0.05 when compared with nitric oxide (NO) level of control (serum); ǂ = p < 0.05) when compared with NO level of control (brain); # = p<0.05 when compared with NO of non-treated infected group (infected - serum); Ŧ = p<0.05 when compared with NO of non-treated infected group (infected - brain)

