
Fig. 2.
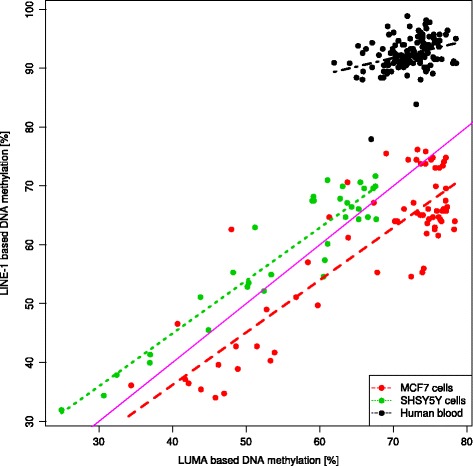
Scatterplot of the raw measurements (n = 238, Table 1) of global DNA methylation using the LINE-1 (ordinate) vs. the LUMA (abscissa) based bioassays, differently colored for single data subsets. The solid magenta line marks identity, and the dashed or dotted lines colored as the respective data show the results of the linear regression analysis for each data subset (Table 1)