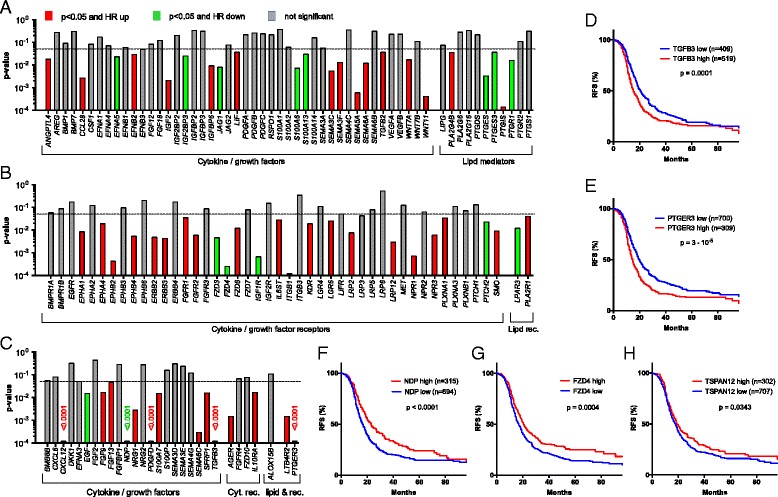
Fig. 9.

Association of RFS with the expression of genes coding cytokines, growth factors, and lipid mediators or their receptors. Panels (a)–(c) represent summaries of RFS analyses for 1018 serous ovarian carcinoma patients depicting the results of logrank P tests and the directions of the respective hazard ratio (HR), using the KM plotter database [38]. a, b Survival analysis for genes in Fig. 2 with an expression ratio (tumor cell/TAM) >0.3. Genes missing from the microarray datasets used by KM Plotter were not included in panels (a)–(c). Significant instances (for “JetSet best probe”) are shown in red (HR >1) or green (HR <1); gray bars indicate lack of significant associations (p ≥0.5) or p > Benjamini-Hochberg critical value for FDR = 0.10. Significance was determines as in Fig. 8. c Survival analysis as before, but for genes expressed only in small subgroups of patients (see Table 1 and Additional file 3: Dataset S1 ). d–h Kaplan–Meier plots analyzing the RFS of patients with high or low levels of TGFB3, PTGER3, NDP, or TSPAN12A expression. See “Methods” for details
