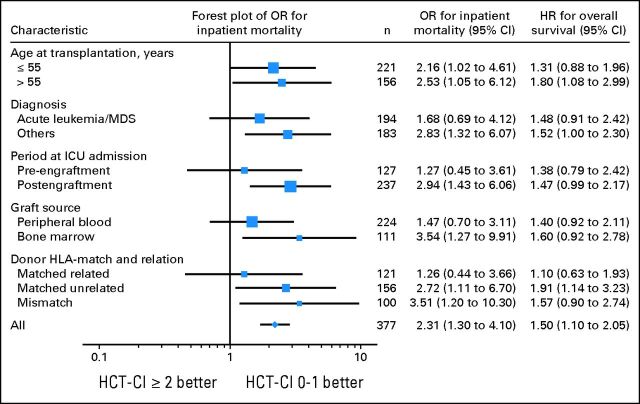
Fig 1.
Subgroup analyses of inpatient mortality and overall survival comparing patients with Hematopoietic Cell Transplantation–Specific Comorbidity Index (HCT-CI) scores ≥ 2 versus patients with scores of 0 to 1. Forest plot demonstrates the odds ratios (OR) for inpatient mortality. HR, hazard ratio; ICU, intensive care unit; MDS, myelodysplastic syndrome.

