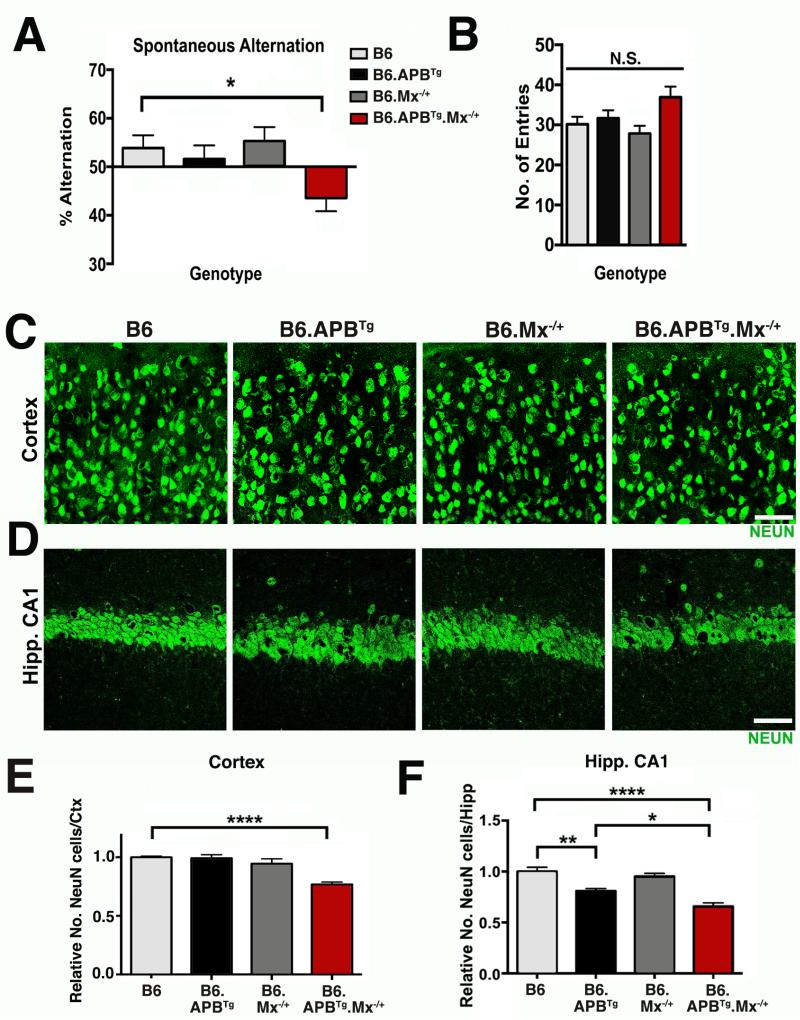
Figure 2. Y-maze deficits and neuronal cell loss in B6.APBTg.Mx−/+ mice.
(A) Y-maze spontaneous alternation test shows significant deficits in percentage of alternation in B6.APBTg.Mx−/+ mice when compared with B6, B6.Mx−/+, and B6.APBTg mice at 14 months of age. (B) No significant differences in the number of entries during the test were found between the groups. (C) Representative images of NEUN immunostaining in the cortex of B6, B6.APBTg, B6.Mx−/+, and B6.APBTg.Mx−/+ mice at 14 months of age. (D) Representative images of NEUN immunostaining in the hippocampal CA1 of B6, B6.APBTg, B6.Mx−/+, and B6.APBTg.Mx−/+ mice at 14 months of age. (E) Quantitative analysis of NEUN-immunostained neurons in the cortex of B6, B6.APBTg, B6.Mx−/+, and B6.APBTg.Mx−/+ mice at 14 months of age, showing a significant decrease of neurons in B6.APBTg.Mx−/+ mice. (F) In the hippocampal CA1, quantitative analysis of NEUN+ neurons shows a significant decrease in B6.APBTg and B6.APBTg.Mx−/+ mice, compared to B6 and B6.Mx−/+mice. However, there is also a significant decrease in NEUN+ neurons in B6.APBTg.Mx−/+ mice compared to B6.APBTg mice. In (A-B), n=8 mice per group. In (E-F) n= 4 mice per group. In (A-B) and (E-F) values are mean ± SEM. *P< 0.05, **P= 0.001, and ****P< 0.0001 by one-way ANOVA. Scale bars: 50μm.

