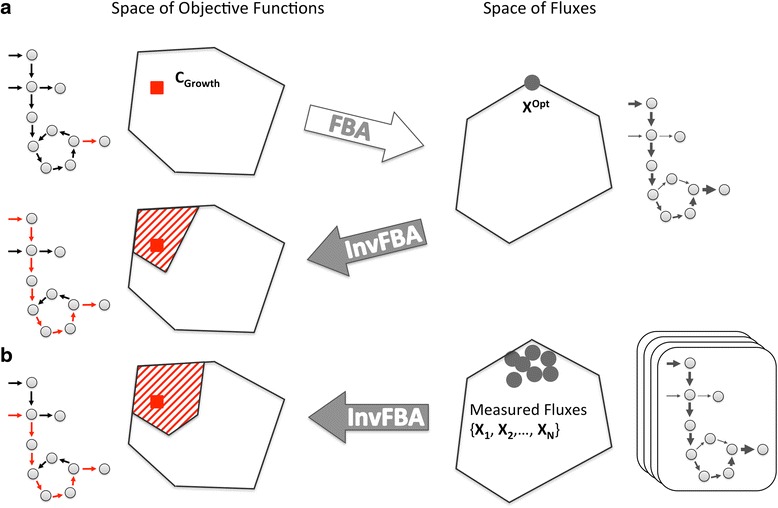
Fig. 1.

Schematic representation of how FBA and invFBA work. This diagram illustrates concisely the flow of information for invFBA calculations in this work. The right part of the figure displays schematic representations of the set of metabolic fluxes. Each flux vector can also be visualized on a metabolic chart (right-most part of the figure), where gray arrows of different thicknesses indicate different intensities of reaction fluxes throughout a network. The left part of the figure displays instead the space of metabolic objectives. Coefficients of the objective function can also be visualized on a metabolic chart (left-most part of the figure), with red arrows representing non-zero components of the objective. a FBA uses a given objective function (here c growth) to predict a set of fluxes (X Opt), or multiple equivalent sets of fluxes (not shown). From one FBA solution, one can use invFBA to infer possible objective functions. The solution is not necessarily unique, though the space of possible solutions can be rigorously characterized, and contains the original objective function. b InvFBA can be applied to multiple (noisy) experimental measurements of fluxes, leading, as in the test case of (a), to a space of possible objective functions
