Fig. 1.

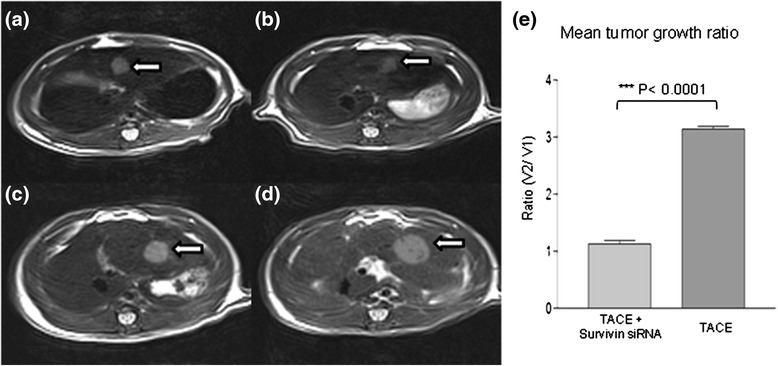
Transverse unenhanced T2-weighted TSE MR images of solid liver tumor in a group A (TACE+ survivin siRNA) (images a and b) and group B (control group, TACE alone) (images c and d) in ACI rat. 3870/80 matrix was acquired. a Pretreatment shows a small hyperintense tumor (arrow) in the left lateral liver lobe (0.55 × 0.54 cm). b Posttreatment demonstrates the same hyperintense tumor lesion (arrow) (0.55 × 0.53 cm) and has inhomogeneous hypointense area corresponding to intratumoral necrosis. The growth of hepatic tumor is noticeably inhibited after therapy. c Pretreatment shows a small hyperintense tumor (arrow) in the left lateral liver lobe (0.69 × 0.68 cm). d Posttreatment shows the same (1.14 × 0.98 cm) tumor (arrow) exhibiting rapid growth compared with its size before therapy. e Mean tumor growth ratio of post-treated (V2) and pre-treated tumor (V1) by MRI showed significant difference between group A (TACE + survivin siRNA) vs group B (control group, TACE alone)
