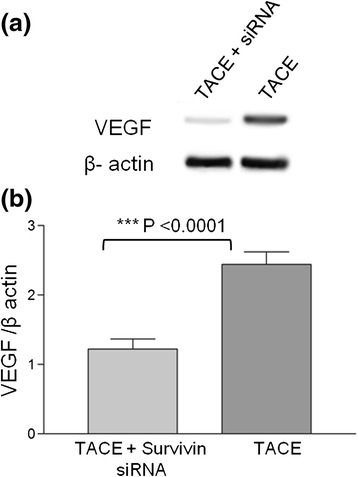
Fig. 2.

Inhibitory effects of survivin siRNA on the expression of VEGF by Western blot analysis. a VEGF bands in group A (TACE + survivin siRNA) was suppressed compared to TACE alone (control). Depicted are representative bands from 10 independent experiments (N = 10) (b) Shows the semi quantification of proteins bands, expressed as ratio of VEGF / β-actin. Group A (TACE + survivin siRNA) was down regulated compared to Group B (TACE alone) (N = 10)
