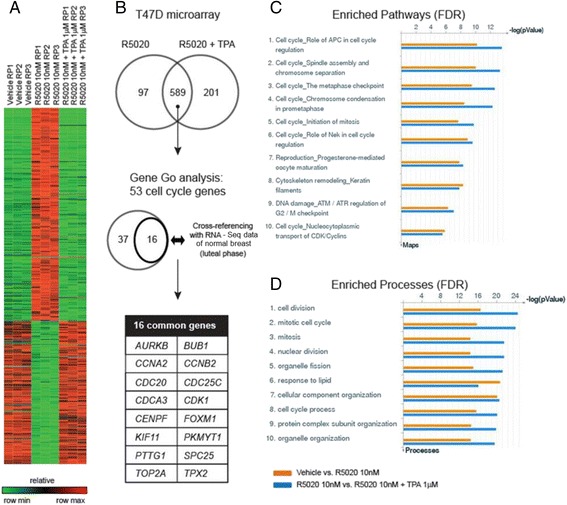
Fig. 6.

Analysis of gene expression microarray. T47D cells were treated with R5020 (10nM) ± TPA (1 μM) for 24 h. Vehicle treated cells were used as a control. Differential gene expression was assayed using the Illumina platform. (a) Heatmap of 589 genes commonly regulated by R5020 and TPA. (b) Identification of 16 cell cycle genes upregulated by progesterone both in normal and breast cancer cells. (c) Top ten enriched pathways for control vs. R5020 and R5020 vs. R5020 + TPA analyzed by GO. (d) Top ten enriched cell processes for control vs. R5020 and R5020 vs. R5020 + TPA
