
Fig. 7.
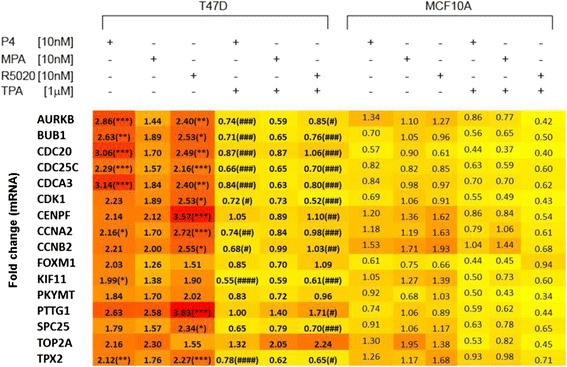
RT-qPCR validation of array data. RT- qPCR data for the sixteen genes show is displayed as a heat map (low to high: yellow to red) with fold-change in mRNA expression within the boxes. Hormone-starved T47D and MCF10A cells were treated for 24 h with Progesterone (P4), Medroxyprogesterone acetate (MPA), or Promegestol (R5020) alone or in combination with telapristone actetate (TPA) as indicated above the map. There were six independent repeats of the experiment. */**/*** represent p-values of < 0.5/<0.01/<0.001, respectively, for R5020 vs. vehicle; and #/##/### represent p-values of <0.5/<0.01/<0.001 for R5020 vs. R5020 + TPA