Fig. 1.

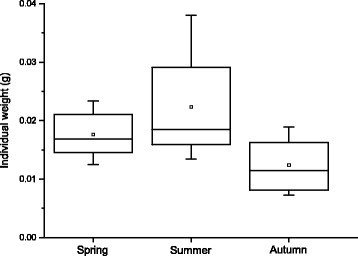
Seasonal profile of the mean acanthocephalan weight (g). Small squares in the boxes are medians, lines are means, boxes are interquartile ranges and error bars are interdecile ranges

Seasonal profile of the mean acanthocephalan weight (g). Small squares in the boxes are medians, lines are means, boxes are interquartile ranges and error bars are interdecile ranges