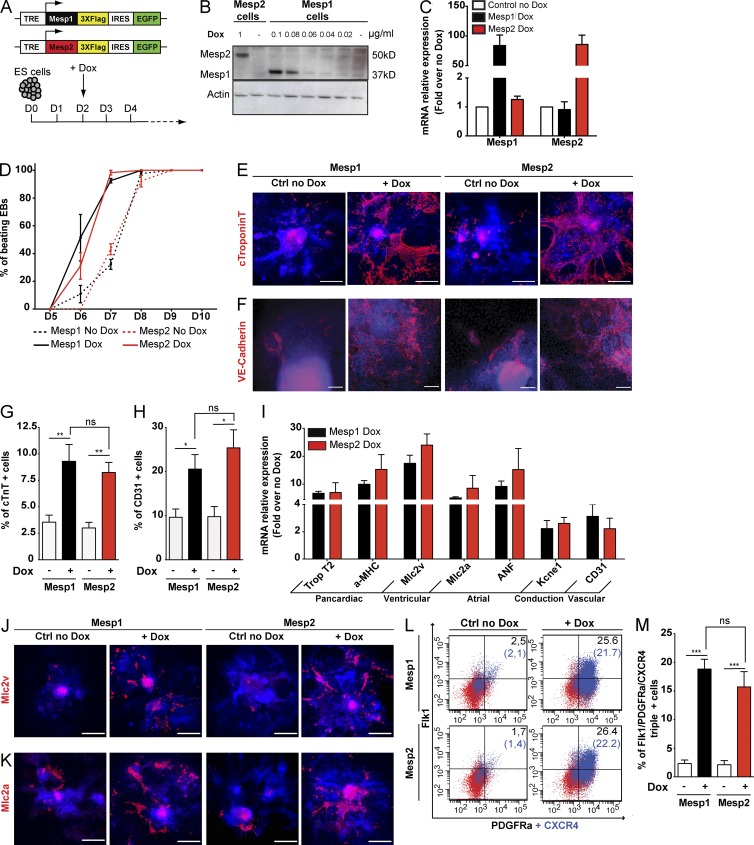
Figure 1.
Mesp1 and Mesp2 equally promote CP specification and differentiation. (A) Schematic representation of Dox-inducible Mesp1 and Mesp2 constructs (top). Experimental design for Dox-inducible Mesp1 or Mesp2 overexpression during EB differentiation (bottom). (B) Western blot analysis of Mesp1-Flag and Mesp2-Flag expression after administration of different concentrations of Dox. (C) qPCR quantification of Mesp1 and Mesp2 expression 24 h after Dox administration. 0.08 and 1 µg/ml Dox were used to stimulate, respectively, Mesp1- and Mesp2-inducible cell lines. Data are normalized to the relative mRNA expression in the absence of Dox and represent mean ± SEM of three biologically independent experiments. (D) Quantification of beating EBs at different times in control conditions and after Dox administration in Mesp1- and Mesp2-inducible ESCs. Data represent mean ± SEM of three biologically independent experiments. At least 60 EBs for each condition were counted. (E and F) Cardiac and vascular differentiation after Mesp1 or Mesp2 overexpression. Immunostaining of EBs at day 8 of EB differentiation, 6 d after Dox addition, using anti-cTnT antibody, a specific marker for cardiomyocytes (E), and anti–VE-cadherin antibody, an EC marker (F). (G and H) FACS quantification of cells positive for cTnT (G) and CD31 (EC marker; H) at day 8 of EB differentiation. Data represent mean ± SEM of at least three biologically independent experiments. (I) qPCR quantification of different cardiovascular markers at day 8 of EB differentiation. Data represent mean ± SEM of three biologically independent experiments. (J and K) Immunostaining of EBs with anti-Mlc2v antibody, a specific marker for ventricular cells (J), and anti-Mlc2a antibody, a marker for atrial cells and immature CMs (K) at day 8 of EB differentiation. (L and M) FACS quantification of Flk1, PDGFRa, and CXCR4 triple-positive CPs at day 3, 24 h after Mesp1 or Mesp2 induction, in control and stimulated cells. Percentage of Flk1/PDGFRa-positive cells and Flk1/PDGFRa/CXCR4-positive cells (in blue and in parentheses) are shown. Data represent mean ± SEM of at least four biologically independent experiments. E, F, J, and K are mosaic reconstructions of several microscopic images generated using a 10% overlap between each single acquisition. Western blots and all immunostainings are representative images of at least three independent experiments. Bars: (E, J, and K) 500 µm; (F) 100 µm. *, P < 0.05; **, P < 0.01; ***, P < 0.001; ns, not significant.

