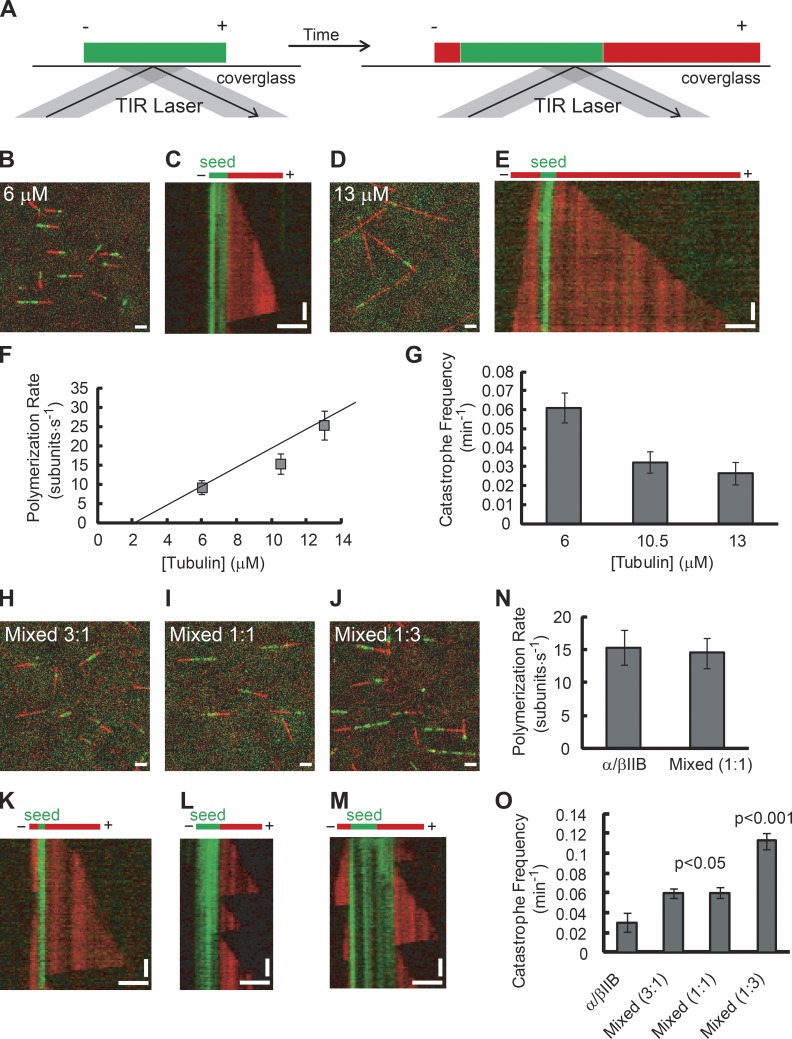
Figure 2.
Single-filament TIRF analysis of α/βIIB tubulin polymerization properties. (A) TIRF assay schematic. Microtubule extensions (red) and GMPCPP seeds (green) are shown with plus ends (+) and minus ends (−) indicated. TIRF image overlays (B and D) and kymographs (C and E) of microtubule extensions (red) growing from seeds (green; total tubulin: 6 µM [B and C] and 13 µM [D and E]). (F and G) Plus-end polymerization rates (F) and catastrophe frequencies (G) for microtubules composed of α/βIIB at different total tubulin concentrations. The data were pooled from at least three independent experiments. Overlay images (H–J) and kymographs (K–M) of mixed α/βIIB and α/βIII microtubules (α/βIIB:α/βIII ratio, 3:1 [H and K], 1:1 [I and L], or 1:3 [J and M]; total tubulin, 10.5 µM). (N and O) Plus-end polymerization rate (N) and catastrophe frequency (O) for mixed microtubules (α/βIIB:α/βIII ratio, 1:1, total tubulin, 10.5 µM) with α/βIIB shown for reference. The data were pooled from at least two independent experiments. Bars: (horizontal) 3 µm; (vertical) 2 min. Error bars are SD. For catastrophe frequency (fcat), SD were calculated as fcat/ (assuming a Poisson distribution), where n is the number of catastrophe events. Table 1 summarizes these measurements.

