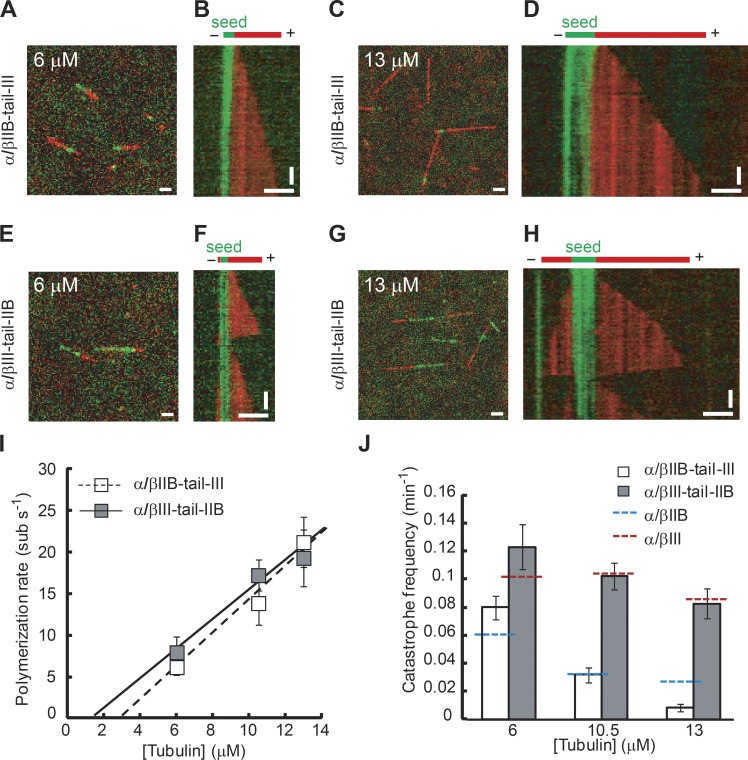
Figure 4.
Single-filament TIRF analysis of chimeric β tubulins. TIRF image overlays (A, C, E, and G) and kymographs (B, D, F, and H) showing microtubule extensions (red) growing from GMPCPP seeds (green) assembled with α/βIIB-tail-III (A–D) or α/βIII-tail-IIB (E–H). (I and J) Plus-end polymerization rates (I) and catastrophe frequencies (J) for chimeric α/βIIB-tail-III or α/βIII-tail-IIB microtubules at different free tubulin concentrations. Catastrophe frequency measurements for full-length α/βIIB (blue dashed line) and α/βIII (red dashed line) are shown for reference. The data were pooled from at least three independent experiments. Error bars are SD. For catastrophe frequency (fcat), SD were calculated as fcat/ (assuming a Poisson distribution), where n is the number of catastrophe events. Bars: (horizontal) 3 µm; (vertical) 2 min. Table 1 summarizes these measurements.

