Fig 3.

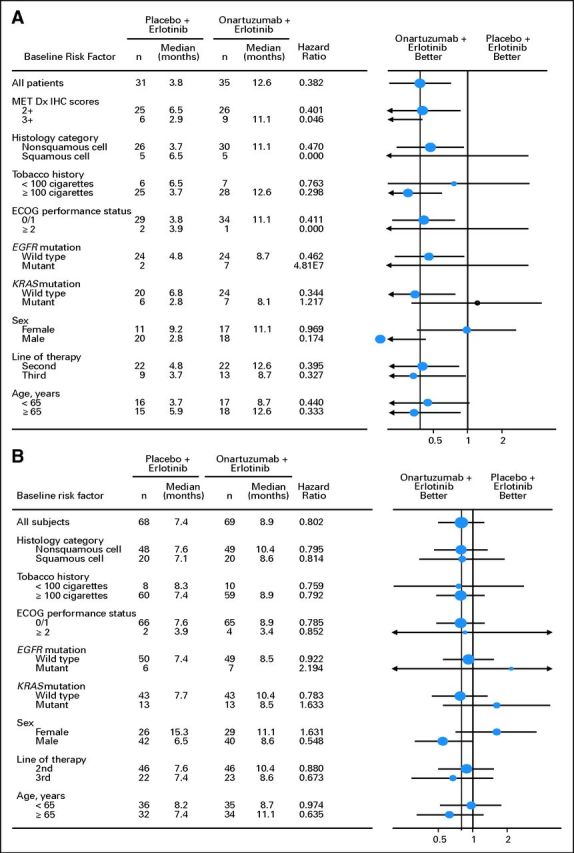
Forest plots of overall survival outcomes in (A) MET-positive and (B) intent-to-treat populations. Dx, diagnosis; ECOG PS, Eastern Cooperative Oncology Group performance status; HR, hazard ratio; IHC, immunohistochemistry.

Forest plots of overall survival outcomes in (A) MET-positive and (B) intent-to-treat populations. Dx, diagnosis; ECOG PS, Eastern Cooperative Oncology Group performance status; HR, hazard ratio; IHC, immunohistochemistry.