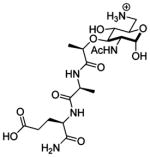
Table 2.
Cellular Effects of Peptidoglycan Derivatives on Nod2 Signaling and Stabilitya
| Compound | NF-κB Fold Activation ± SD | Half-life (h)± SD |
|---|---|---|
| Control | No activation | 7.1 ±1.4 |
| 1 | 1.8 ±0.3 | 15.9 ±4.1* |
| 2 | 3.1 ±0.3 | 23.1 ±2.2* |
| 3 | No activation | 7.7 ±0.7 |
| 8 | 2.2 ±0.3 | Not tested |
| 9 | 2.6 ±0.4 | 10.5 ±2.6* |
| 10 | 1.9 ±0.3 | 15.0 ±1.8* |
| 11 | 2.3 ±0.3 | Not tested |
| 12 | 2.4 ±0.3 | 11.7 ±2.7* |
| 13 | 1.8 ±0.3 | 8.9 ±0.9* |
| 15 | 2.5 ±0.3 | Not tested |
| 16 | No activation | 8.0 ±0.7 |
 18 |
2.8±0.119 | 19.0 ±1.8* |
(+) Nod2 plasmid NF-κB activation normalized to the (−) Nod2 plasmid. Nod2 band intensities were plotted against time assuming first-order decay (ln(Ir) vs time). The rate constant was calculated using the negative slope of the line (k = −slope), and the corresponding half-life was calculated (T1/2 = ln(2)/k).21 SD = standard deviation.
= P < 0.05, stabilizes compared to the untreated control. The control, 3, and 16 did not significantly activate.
