
Figure 1.
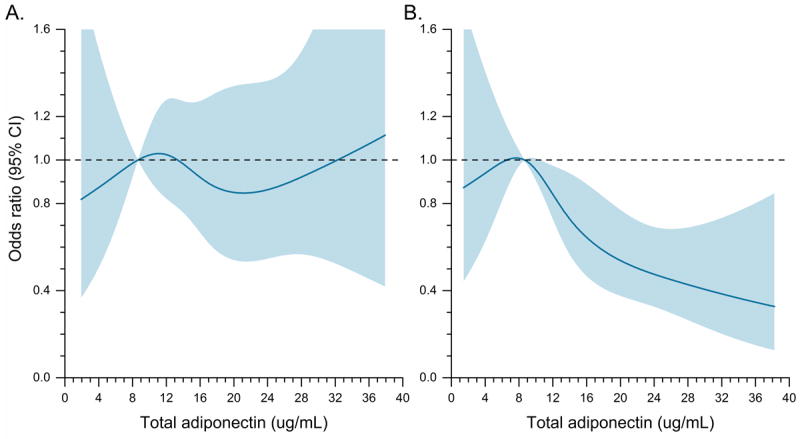
Risk of MM in relation to circulating total adiponectin levels estimated using restricted cubic spline regression models with 4 knots, among individuals with A) body mass index (BMI) <25 kg/m2 (P-linear = 0.8, P-nonlinearity = 0.8); and B) BMI ≥25 kg/m2 (P-linear = 0.0001, P-nonlinearity = 0.4). The odds ratio is represented by the solid line, and the 95% confidence interval (CI) is represented by the shaded area.