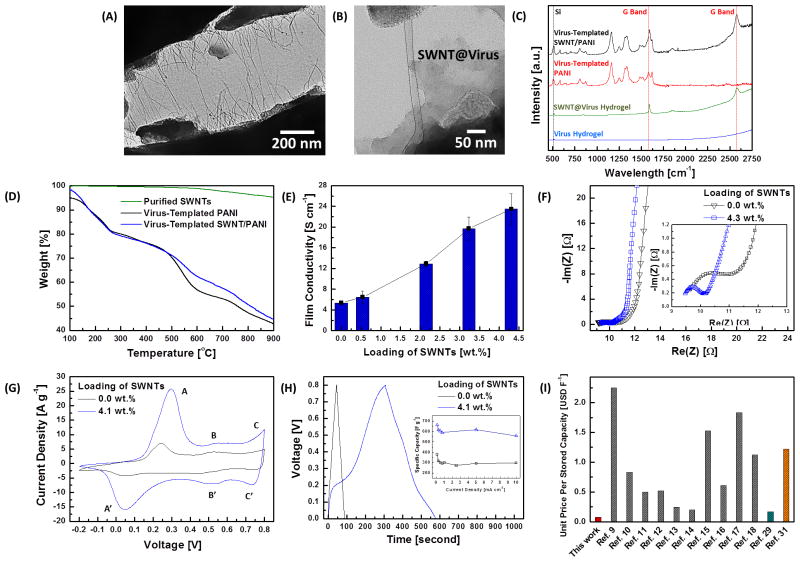
Figure 3.
A, B. TEM images of the virus-templated SWNT/PANI complex. The SWNT@virus are present and well-dispersed inside the PANI NW. C. Raman spectra of the virus hydrogel, SWNT@virus hydrogel, virus-templated PANI and SWNT/PANI films. D. TGA measurements of the purified SWNTs, virus-templated PANI and SWNT/PANI films (virus:SWNT = 1:8). Loading of SWNTs in the SWNT/PANI films (virus:SWNT = 1:8) is estimated ~4.3 wt.%. E. Electrical conductivity measurement on the virus-templated PANI and SWNT/PANI thin films. F. Impedance measurements on the virus-templated PANI and SWNT/PANI (with the loading of SWNTs ~ 4.3 wt.%) thin films. G. CV curves of the virus-templated PANI and SWNT/PANI (with the loading of SWNTs ~ 4.3 wt.%) thin films at the scan rate of 10 mV s−1. H. Galvanostatic charge-discharge curves of the virus-templated PANI and SWNT/PANI (with the loading of SWNTs ~ 4.3 wt.%) thin films, and the inset is the specific capacitances as a function of charge-discharge current densities. I. Analysis on the effective cost in USD F−1 of nanocomposites in this work and in the literature. The red, grey, green, and orange bars are the effective cost of the virus-templated SWNT/PANI thin films, SWNT/PANI composite electrodes, MWNT/PANI composite electrode, and rGO/PANI composite electrode, respectively.

