Fig. 1.
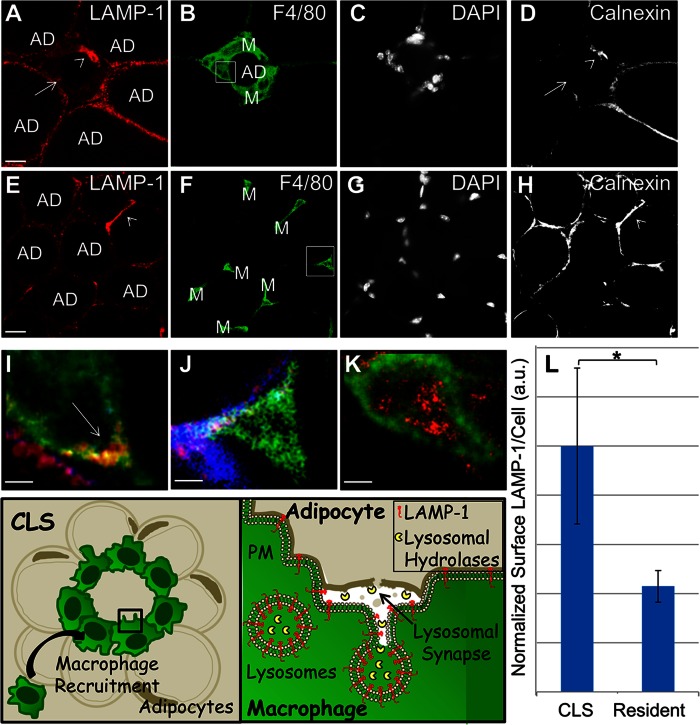
CLS macrophages in murine WAT exhibit increased plasma membrane LAMP-1 staining. A–D: WAT from mice on the HFD was labeled with LAMP-1 (A); F4/80 to indicate macrophages (B); the nuclear stain, DAPI (C); and the endoplasmic reticulum-marker, calnexin, to identify permeable cells (D). E–H: WAT from mice on the LFD was also labeled with LAMP-1 (E), F4/80 (F), DAPI (G), and calnexin (H). Size bars 20 μm. I, J: Enlarged views of representative macrophages for each condition highlighted by boxes in the F4/80 images (red, LAMP-1; green, F4/80; blue, calnexin). A nonpermeable CLS macrophage demonstrating plasma membrane LAMP-1 (arrow) (I) and a nonpermeable resident macrophage that is negative for plasma membrane LAMP-1 (J). K: A macrophage from detergent-permeabilized tissue demonstrating lysosomal LAMP-1, included for comparison. Size bars 5 μm. A total of ten mice were examined, five on the HFD and five on the LFD. L: Plasma membrane LAMP-1 levels were quantified from 1,466 WAT macrophages in mice on the HFD or LFD. Macrophages that were permeable, as assessed by calnexin staining, were excluded from the analysis [e.g., arrowheads in (A) and (D), and (E) and (H)]. Surface LAMP-1 staining more than doubled in CLS macrophages compared with resident macrophages (L). Error bar represents the SEM. *P ≤ 0.05 Wilcoxon rank sum test. Representative adipocytes (AD) and macrophages (M) are labeled. A schematic of the biology under investigation and experimental approach to assay lysosome exocytosis is included.

