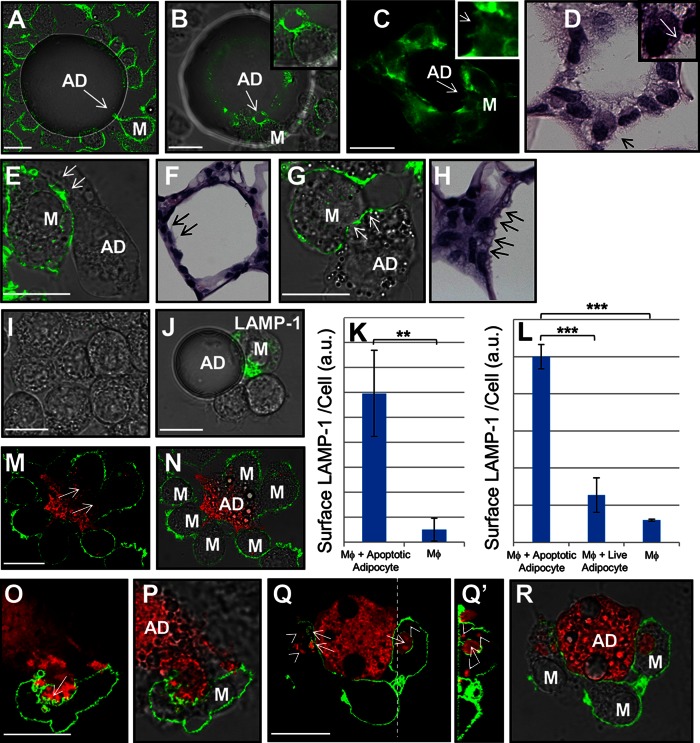
Fig. 2.
CLS cell culture model mirrors in vivo CLS morphology and shows formation of extracellular compartments at sites of contact with apoptotic adipocytes. A: An in vitro CLS in which J774 cells had their plasma membrane labeled with Alexa488-CtB (green) was incubated with UV-induced apoptotic primary murine adipocytes. A macrophage is seen extending plasma membrane protrusions at the point of contact with the adipocyte [arrow (A)]. B: An in vitro CLS in which J774 cells were incubated with UV-induced apoptotic adipocytes and labeled with Alexa488-phalloidin to show F-actin (green). The macrophage, highlighted by an arrow and shown in the inset, is extending F-actin-rich protrusions at the site of contact with the adipocyte. C: F-actin-rich macrophage protrusions (arrow and inset) are also observed in inflamed WAT from a mouse. D: H&E image of a CLS in human breast. The macrophage highlighted by an arrow and shown in detail in the inset can be seen extending protrusions similar to those observed in the model system (B). E: An in vitro CLS in which a macrophage is seen extending F-actin-rich processes at the site of contact with an UV-induced apoptotic adipocyte (arrows). F: Similar processes are seen in an H&E image of a CLS in murine WAT (arrows). G: An in vitro CLS in which the macrophage forms an F-actin-scalloped border at points of contact with an UV-induced apoptotic adipocyte (arrows). H: CLS macrophages in an H&E-stained section of murine mammary WAT exhibit membrane scalloping (arrows). I–K: J774 cells were incubated with UV-induced apoptotic primary murine adipocytes for 90 min. I: In control macrophages, no LAMP-1 immunostaining (green) was observed on the plasma membrane. J: Upon incubation with apoptotic adipocytes, macrophage plasma membrane LAMP-1 (green), a marker of lysosome exocytosis, was increased. K: Quantification of the macrophage surface levels of LAMP-1. Data are from 201 cells in one experiment. Error bar represents the SEM. **P ≤ 0.005 Wilcoxon rank sum test. L: Quantification of the macrophage surface levels of LAMP-1 after incubation with either TNF-α-induced apoptotic or viable 3T3 L1 adipocytes. Macrophage plasma membrane LAMP-1 level was strongly reduced in macrophages incubated with viable adipocytes compared with macrophages incubated with apoptotic adipocytes. Data are from 301 cells in three independent experiments. Error bar represents the SEM. ***P ≤ 0.001 Wilcoxon rank sum test. M–R: Macrophages form extracellular compartments at sites of contact with UV-induced apoptotic adipocytes. 3T3 L1 apoptotic adipocytes were labeled with Alexa546 (red) and incubated with J774 cells for 60 min. Cells were then labeled with Alexa488-CtB on ice and fixed. Representative images are of apoptotic adipocytes (red) and macrophages (green). Fixation that cross-links plasma membrane proteins, preventing postfixation diffusion of the CtB, reveals large sealed zones at the macrophage-adipocyte interface [arrows (M)]. Fixation that allows postfixation diffusion of the CtB on its lipid receptor into the sealed zones reveals extensive plasma membrane ruffling in the region of contact between the macrophage and apoptotic adipocyte [arrow (O)]. Pieces of the adipocyte are seen in extracellular compartments, surrounded by plasma membrane [arrows (Q)], as well as in completely internalized vesicles [arrowheads (Q)], which are negative for CtB. Q’: A confocal vertical section through the dashed line in Q. Size bars 20 μm. AD, adipocyte; M, macrophage.

