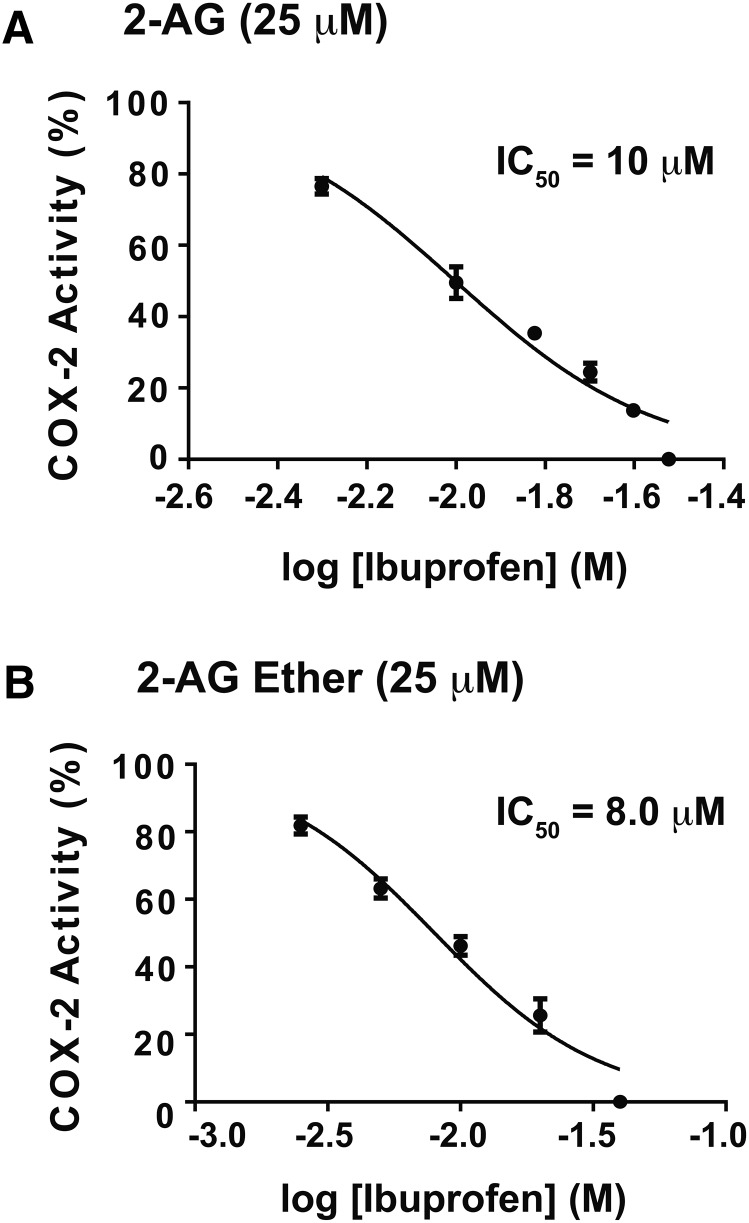
Fig. 5.
Instantaneous inhibition of huPGHS-2-mediated oxygenation of 2-AG and 2-AG ether by IBP. The indicated concentrations of ibuprofen were present in a standard O2 electrode assay mixture along with 25 μM 2-AG (A) or 25 μM 2-AG ether (B) as COX substrates. Purified huPGHS-2 was added to initiate oxygenation reactions. O2 consumption was monitored as described in the Experimental Procedures. Results are shown for a single experiment involving triplicate determinations. The error bars indicate the average ± SD. When control values are normalized to 100% activity, significant differences from the control value (with no ibuprofen) were seen at all the ibuprofen concentrations tested, as determined by the Student’s t-test (P < 0.05). IC50 values shown in the two panels were calculated using GraphPad Prism software. For the monophasic mode shown in the two panels in this figure, IC50 values were calculated by using nonlinear regression to fit the data to the log [ibuprofen] versus normalized response (variable slope) curve.

