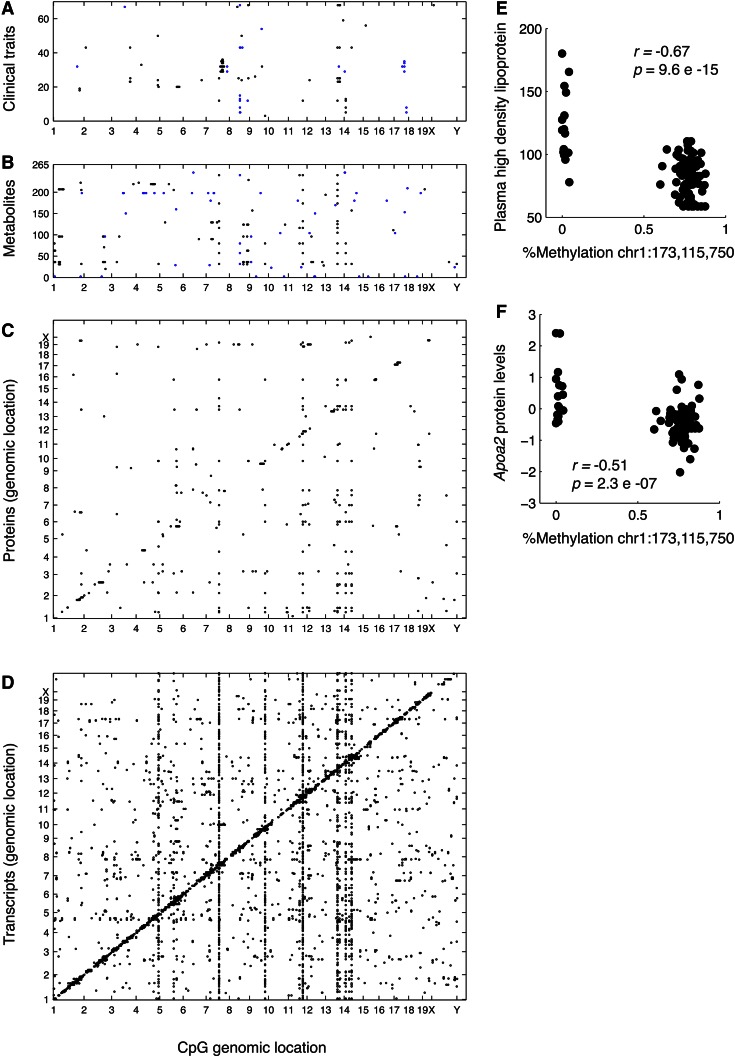
Fig. 2.
The flow of biologic information from liver DNA methylation to liver transcripts, proteins, and metabolites, and then clinical traits. The genomic positions of hypervariable CpGs are shown on the x axes and the y axes denote clinical traits (A), metabolites (B), proteins (C), or transcripts (D). In (C) and (D), the proteins or transcripts are plotted on the y axis according to the location of the encoding gene. Each dot is a significant association at the corresponding Bonferroni thresholds across CpGs tested with levels of clinical traits or levels of metabolites, proteins, or transcripts in liver. E, F: The association of percent methylation of a CpG on chromosome 1 at 173,115,750 base pairs (x axis) versus the levels of plasma HDL cholesterol (E) or apoAII (F). Reproduced from (63), with permission.

