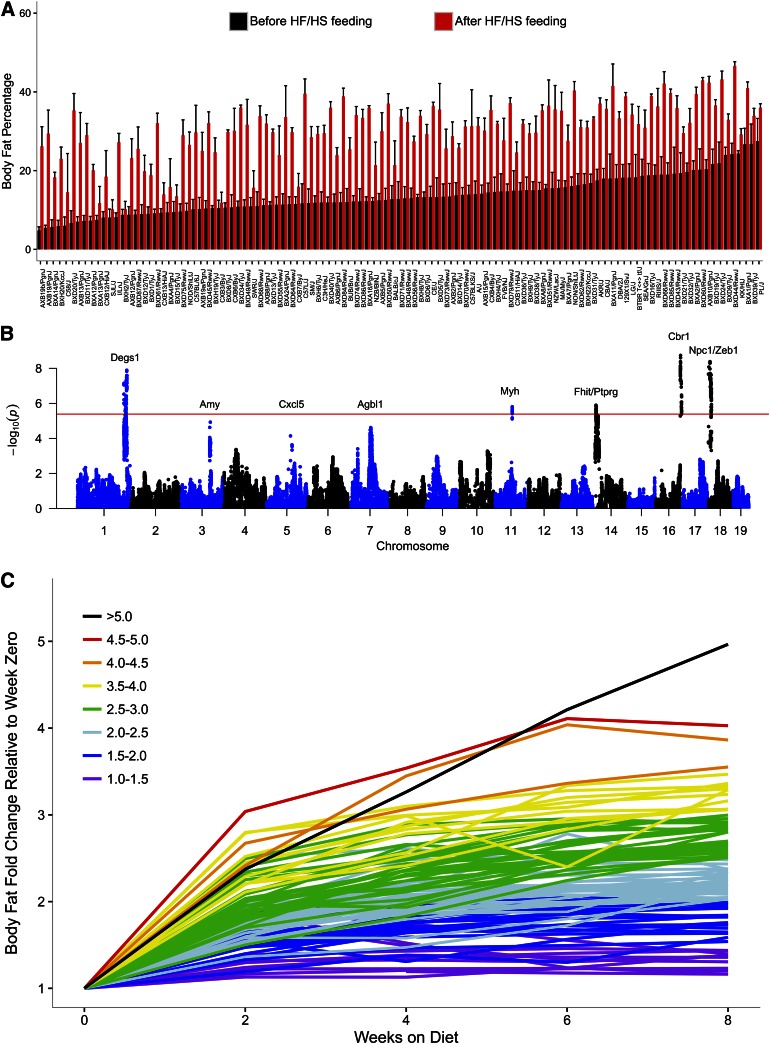
Fig. 4.
Genetic control of response to high-fat (HF) high-sucrose (HS) diet. Mice of the HMDP strains (six to eight male mice per group) were maintained on a low-fat chow diet until 8 weeks of age, when they were placed on a high-fat (32% kcal) and high-sucrose (25% kcal) diet for 8 weeks. The percent body fat on chow or on high-fat diet is shown in (A) and a GWAS of the percent body fat change following feeding of the diet is shown in (B). The red line in (B) indicates the threshold for genome-wide significance and likely candidate genes under each peak are indicated. The increase in percent body fat in response to the diet largely plateaus after about 4 weeks (C), consistent with a genetically controlled “setpoint” model of obesity (21). Reproduced from (21), with permission.

