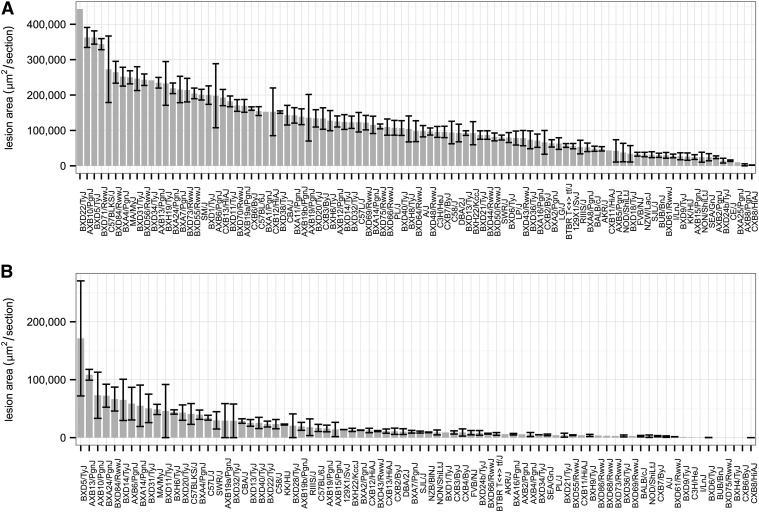
Fig. 6.
Atherosclerosis in the HMDP. Atherosclerosis lesion size (μm2 ± SEM) in the proximal aorta was quantitated in 697 female (A) and 281 male (B) mice using oil red O staining. In each panel, stains are arranged in rank order by strain-average lesion area. As discussed in the text, the null mice were on an APOE-Leiden, CETP transgene background and were fed a Western diet for 16 weeks. Data from Bennett et al. (49) with permission.

