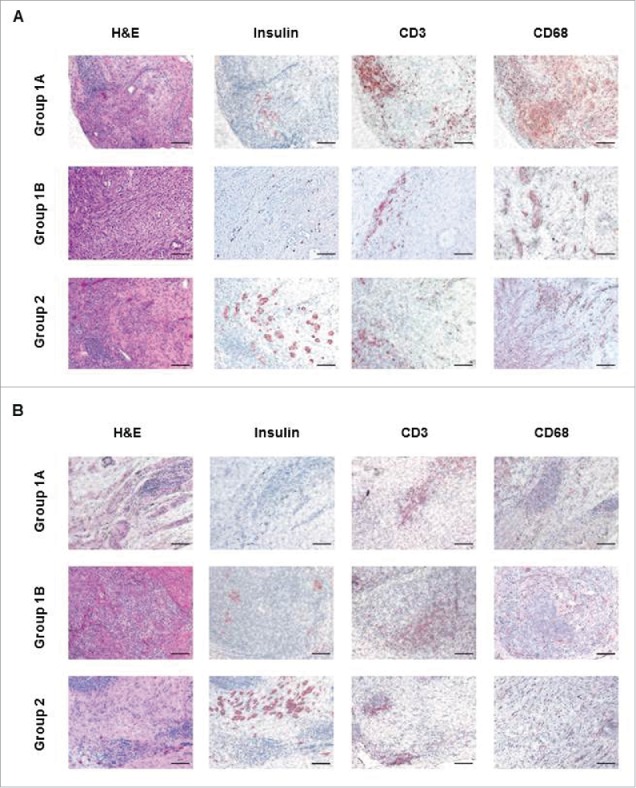
Figure 6.

Comparison of histopathological examination in Groups 1 and 2 (A). Histopathological examination of islet allografts at biopsy (2 weeks after transplantation) of sections stained with hematoxylin and eosin (H&E, left columns), immunostained for insulin (second columns panels), CD3 cells (third column), and CD68 cells (right column). While Group1A or Group1B insulin-positive islets were fragmented, Group2 grafts showed preserved islet morphology. Cell infiltration was observed in H&E staining in biopsies from all groups, and most of the infiltrating cells were positive for CD3. CD68-positive cell infiltration was possibly more intensive in the Group1A pigs. (B) Histopathological examination of islet allografts at necropsy was performed 4 weeks after transplantation. While Group1A or Group1B insulin-positive islets were fragmented, Group2 grafts showed preserved islet morphology. Scale bars: 50μm.
