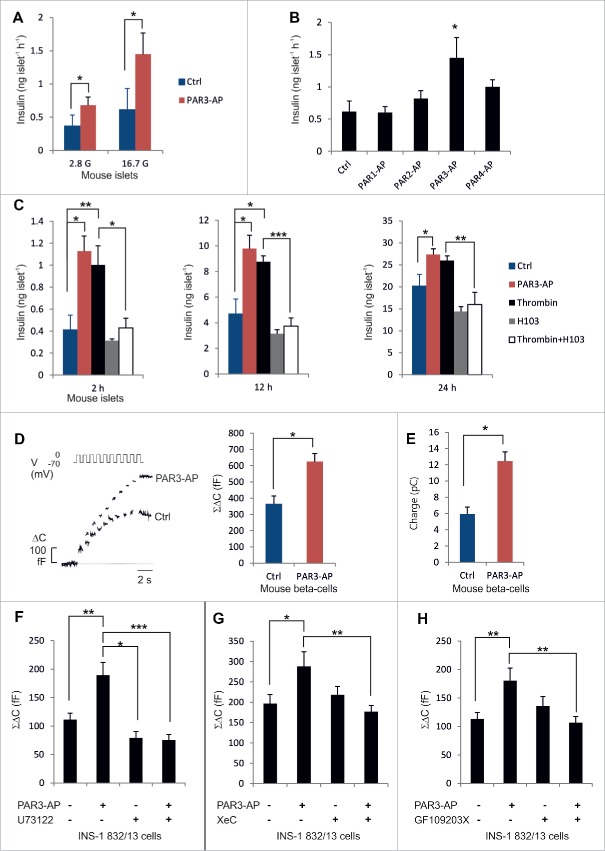
Figure 2.
Effects of thrombin and PAR3-AP on insulin secretion. (A–B) Insulin secretion in response to 1-h incubations (n = 4–8). C. Accumulated insulin in the incubation medium (n = 5). D–E. Increase in cell capacitance (ΔC), reflecting exocytosis, and integrated Ca2+-current (n = 15–20). F-H. Total capacitance increase in INS-1–832/13-cells (n = 10–20). Means±s .e.m.*P < 0 .05;**P < 0 .01;***P < 0 .001.

