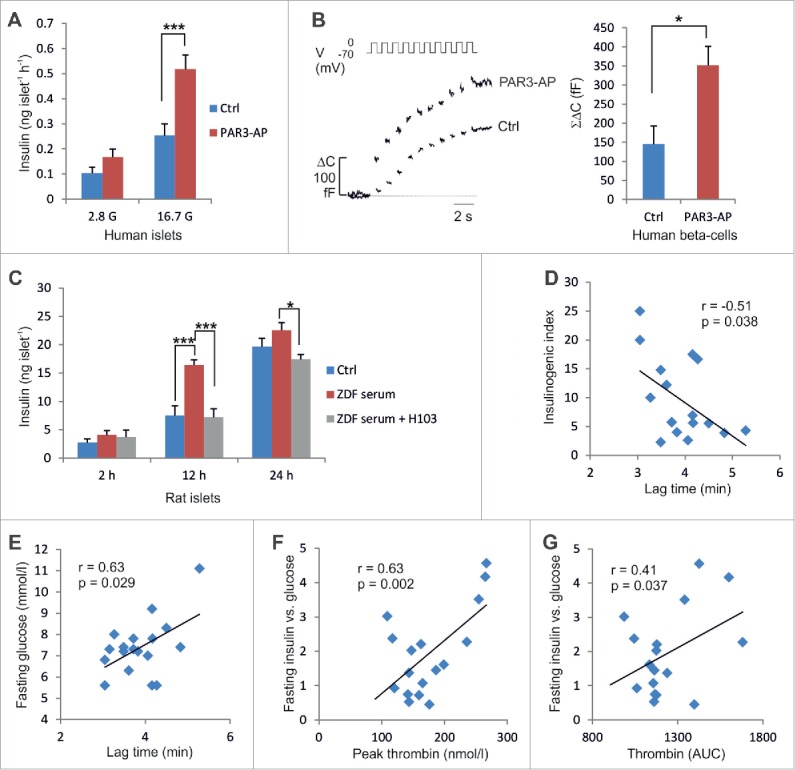
Figure 4.

PAR3-AP effects in human islets and thrombin generation in T2D patients. (A) Insulin secretion in human islets (n=4 −8). (B) Increase in cell capacitance (n = 11–12). (C) Accumulated insulin levels following 2, 12 or 24-h incubations of islets from non-diabetic Wistar rats in medium supplemented with plasma from Wistar rats (Ctrl) or ZDF rats with or without 25 μg/ml H103 (n = 5–10). (D–E) The lag time of thrombin activation plotted against insulinogenic index and fasting glucose. (F-G) The peak concentration of thrombin and endogenous thrombin potential (AUC), respectively, plotted against fasting insulin corrected for glucose (n = 17).
