
Figure 2.
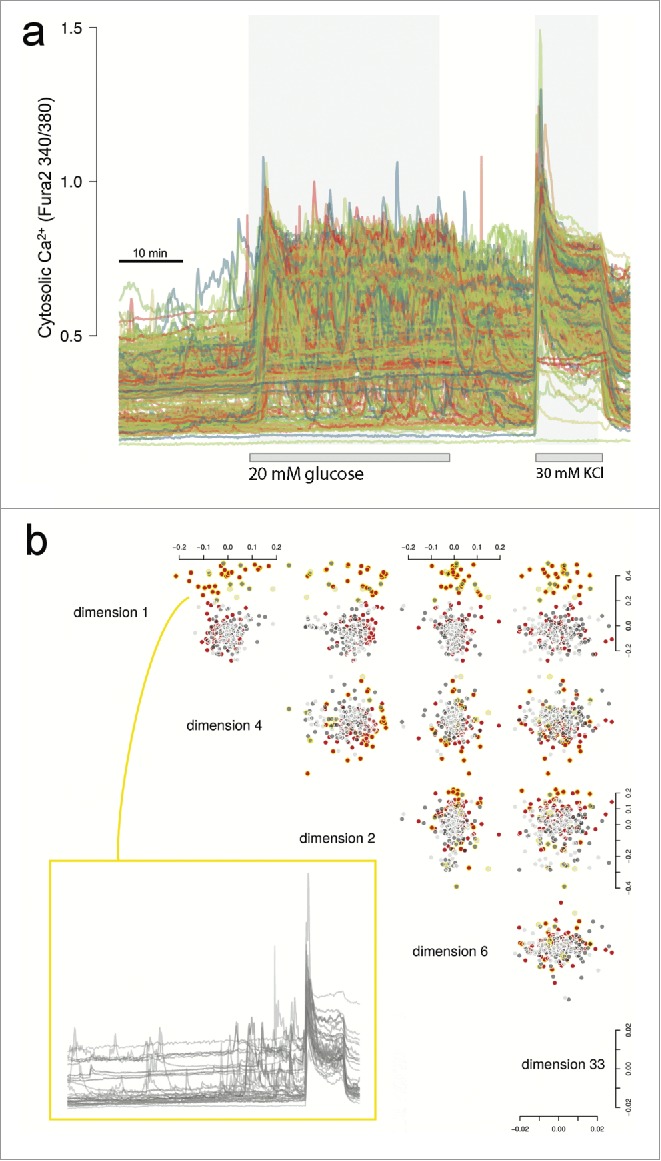
Ca2+ traces and exploratory data analysis. (A) Raw Ca2+ traces from Fura-2 stained islet cells showing the timed glucose perturbations and KCl depolarisation. (B) Cells were imaged in three microscopy fields (Supplementary Fig. 1). Shown are the five top ranked MDS dimensions of the raw Ca2+ traces based on large mean silhouette width between the fields (details provided in Supplementary Information). Cells are colored red, dark gray or light gray to reflect the three different microscopy fields. We noticed that the cluster of cells circled in yellow enriched for cells of one field due to inhomogeneous dispersion, but more importantly that these cells showed a distinct Ca2+ trace pattern irrespective of field. The traces are shown for these cells which are mostly/only responding during KCl depolarisation.