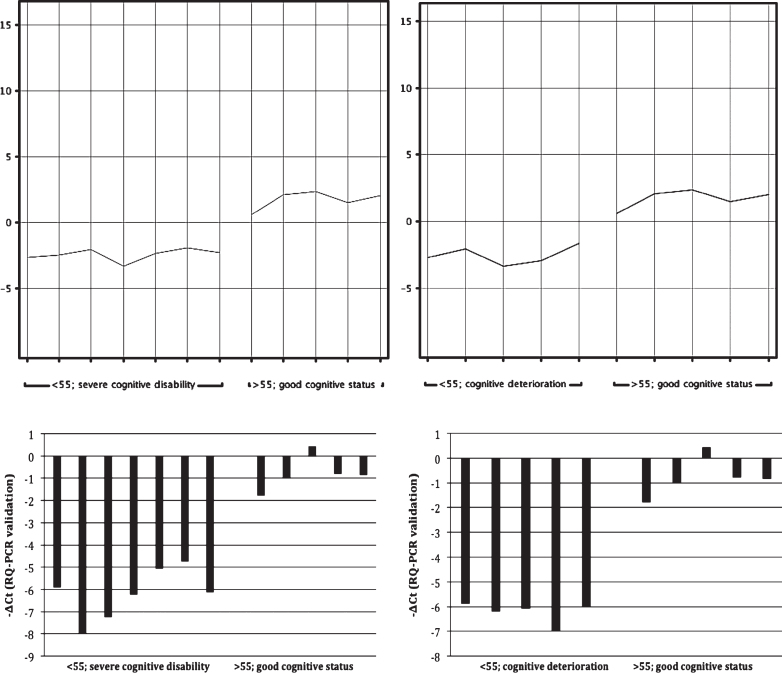
Fig.1.
Expression of the MTRNR2L12 gene. Comparison of the groups of older (>55 y) patients with good/acceptable cognitive status and of younger (<55 y) patients with severe cognitive disability is presented on the left. Comparison of the same group of older patients with the group of younger (<55 y) patients with documented dementia is depicted on the right. Normalized intensity values representing expression of the MTRNR2L12 gene (microarray analysis) are visible above whereas the corresponding -ΔCt values (the RQ-PCR confirmatory analysis) are shown below.

