Figure 1.
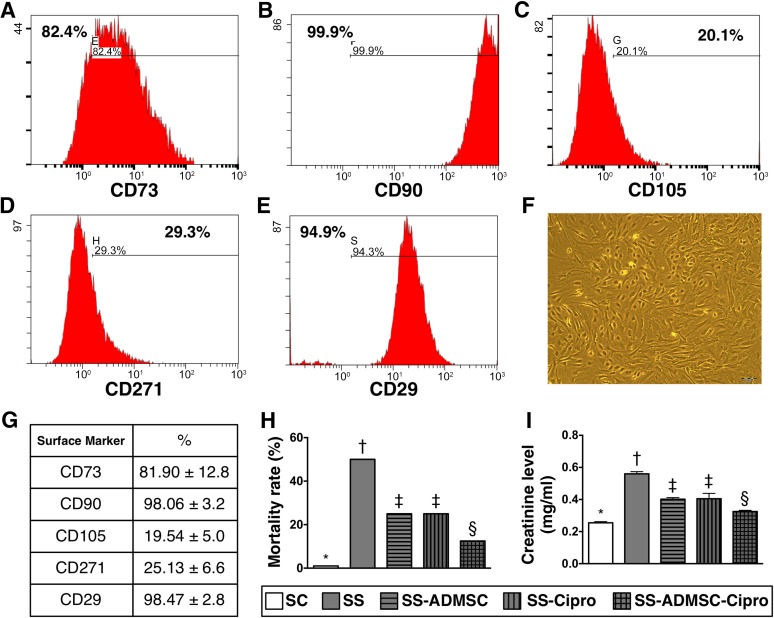
The flow cytometric analysis, mortality rate, and circulating level of creatinine by day 5 after SS induction (n = 16). (A–E): Flow cytometric analysis by day 14 after cell culturing. (F): Spindle-shape picture of the cells in culture plate, a typical appearance of mesenchymal stem cells (original magnification, ×100). (G): CD90+ and CD29+ cells were the two highest populations of ADMSCs. (H): Statistical analysis of mortality rate among five groups. ∗, p < .0001 vs. other groups with different symbols (∗, †, ‡). (I): Statistical analysis of circulating creatinine level; ∗, p < .0001 vs. other groups with different symbols (∗, †, ‡, §). All statistical analyses were performed by one-way analysis of variance, followed by Bonferroni multiple-comparison post hoc test (n = 10 for group 1; n = 8 for group 2; n = 12 for groups 3 and 4; n = 14 for group 5). Symbols (∗, †, ‡, §) indicate significance (at the .05 level). Abbreviations: ADMSC, adipose-derived mesenchymal stem cell; Cipro, ciprofloxacin; SC, sham control; SS, sepsis syndrome.

