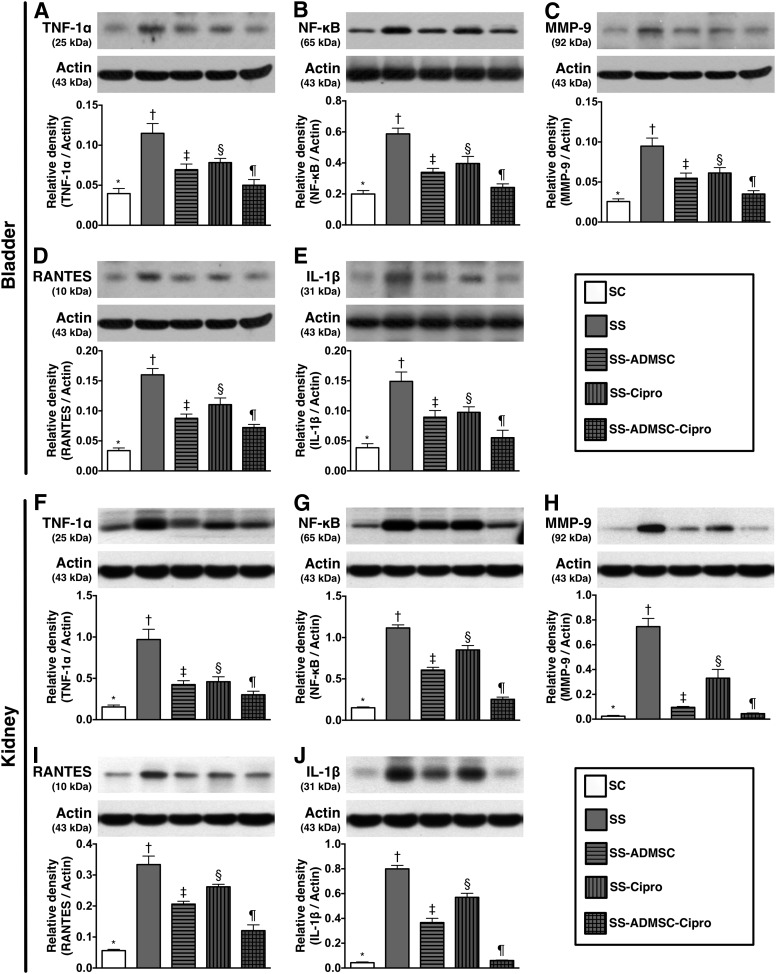
Figure 2.
The protein expressions of inflammatory biomarkers in urinary bladder and kidney parenchyma by day 5 after sepsis induction (n = 8). Upper panel (protein expressions in bladder): (A): Protein expression of TNF-1α, ∗, p < .001 compared with other groups with different symbols (∗, †, ‡, §, ¶). (B): Protein expression of NF-κB. ∗, p < .001 vs. other groups with different symbols (∗, †, ‡, §, ¶) . (C): Protein expression MMP-9. ∗, p < .001 vs. other groups with different symbols (∗, †, ‡, §, ¶). (D): Protein expression of RANTES. ∗, p < .0001 vs. other groups with different symbols (∗, †, ‡, §, ¶). (E): Protein expression of IL-1β. ∗, p < .0001 vs. other groups with different symbols (∗, †, ‡, §, ¶). Lower panel (protein expression in kidney parenchyma): (F): Protein expression of TNF-1α. ∗, p < .0001 vs. other groups with different symbols (∗, †, ‡, §, ¶). (G): Protein expression of NF-κB. ∗, p < .0001 vs. other groups with different symbols (∗, †, ‡, §, ¶). (H): Protein expression of MMP-9. ∗, p < .0001 vs. other groups with different symbols (∗, †, ‡, §, ¶). (I): Protein expression of RANTES. ∗, p < .0001 vs. other groups with different symbols (∗, †, ‡, §, ¶). (J): Protein expression of IL-1β. ∗, p < .0001 vs. other groups with different symbols (∗, †, ‡, §, ¶). All statistical analyses were performed by one-way analysis of variance, followed by Bonferroni multiple-comparison post hoc test. Symbols (∗, †, ‡, §, ¶) indicate significance (at the .05 level). Abbreviations: ADMSC, adipose-derived mesenchymal stem cell; Cipro, ciprofloxacin; IL, interleukin; MMP-9, matrix metalloproteinase-9; NF, nuclear factor; RANTES, regulated on activation, normal T-cell expressed and secreted; SC, sham control; SS, sepsis syndrome; TNF, tumor necrosis factor. The error bars are defined as standard error of the mean.

