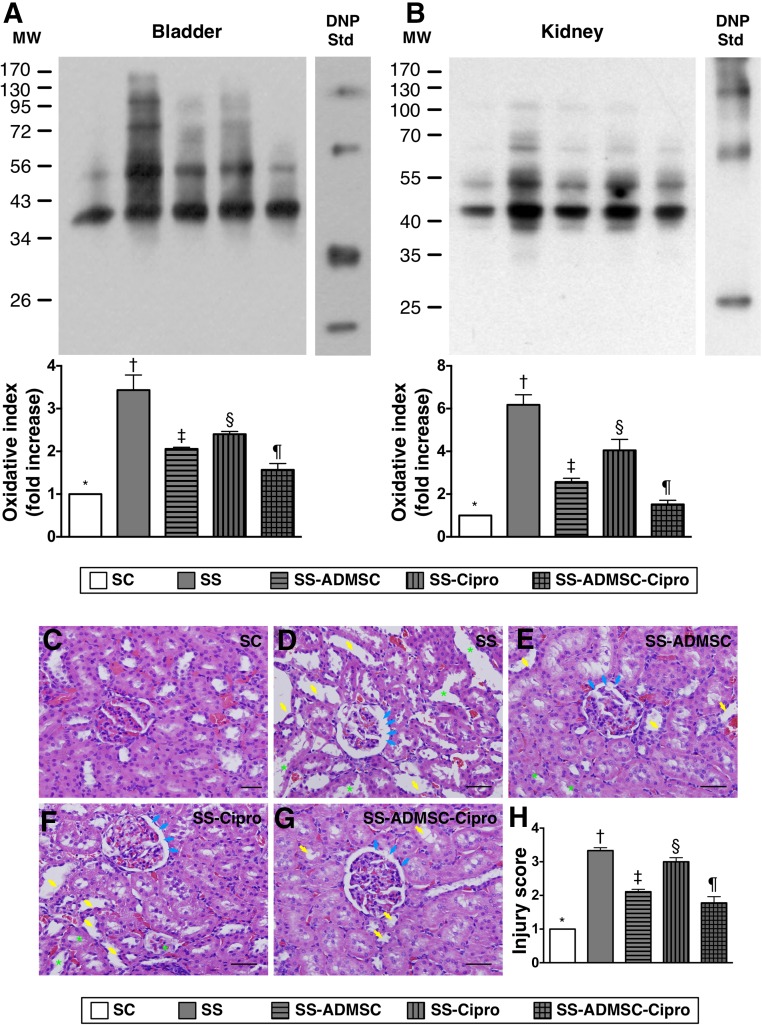
Figure 7.
The protein expression of oxidative stress in urogenital organs and pathological assessment of the kidney parenchyma by day 5 after sepsis induction. (A): Protein expression of oxidized protein (i.e., oxidative index) in urinary bladder. ∗, p < .0001 vs. other groups with different symbols (∗, †, ‡, §, ¶). (B): Protein expression of oxidized protein in kidney parenchyma. ∗, p < .0001 vs. other groups with different symbols (∗, †, ‡, §, ¶). (Note: left and right lanes shown in the upper panel represent protein MW marker and control oxidized molecular protein Std, respectively). (C–G): Hematoxylin and eosin stain (original magnification, ×200) demonstrating significantly higher degree of loss of brush border in renal tubules (yellow arrows), tubular necrosis (green asterisk), and dilatation of Bowman capsule (blue arrows) in SS group than in other groups. (H): Analytical result of kidney injury score. ∗, p < .001 vs. other groups with different symbols (∗, †, ‡, §, ¶). All statistical analyses were performed by one-way analysis of variance, followed by Bonferroni multiple-comparison post hoc test. Symbols (∗, †, ‡, §, ¶) indicate significance (at the .05 level). ADMSC, adipose-derived mesenchymal stem cell; Cipro, ciprofloxacin; DNP, 1-3 dinitrophenylhydrazone; MW, molecular weight; SC, sham control; SS, sepsis syndrome; Std, standard.

