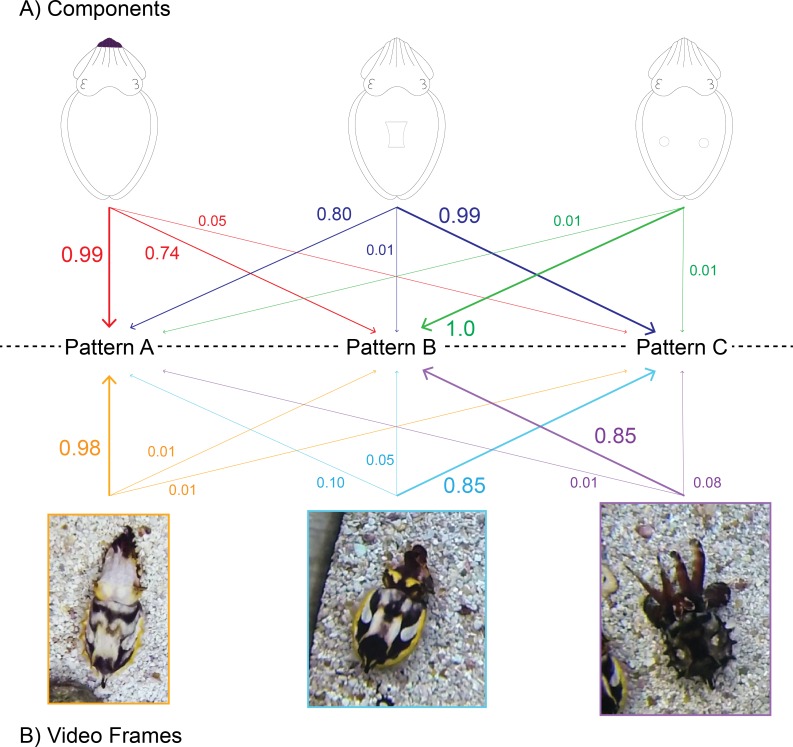
Figure 2. Diagrammatic explanation of the automated signal classification system.
The probabilities that a given component will appear in a pattern (A) and that a specific 1-s clip can be grouped within that pattern (B). Arrow direction represents the grouping of a single component or 1-s clip into one of the three patterns. In this representation, arrow thickness denotes the probability that a component or 1-s clip is found within that pattern. Note that the probabilities expressed in (A) are independent of one another, for example, the probability of dark Arm tips appearing in animals grouped in Pattern A does not impact the probability of dark Arm tips appearing in Pattern B. On the other hand, the probabilities expressed in (B) are related and sum to 1, for example, the first 1-s clip image has a 98% chance that it belongs in the group “Pattern A,” and only a 1% chance that it should be grouped within Patterns B or C. The patterns, components and probabilities expressed in this figure are diagrammatic and do not indicate actual values.

