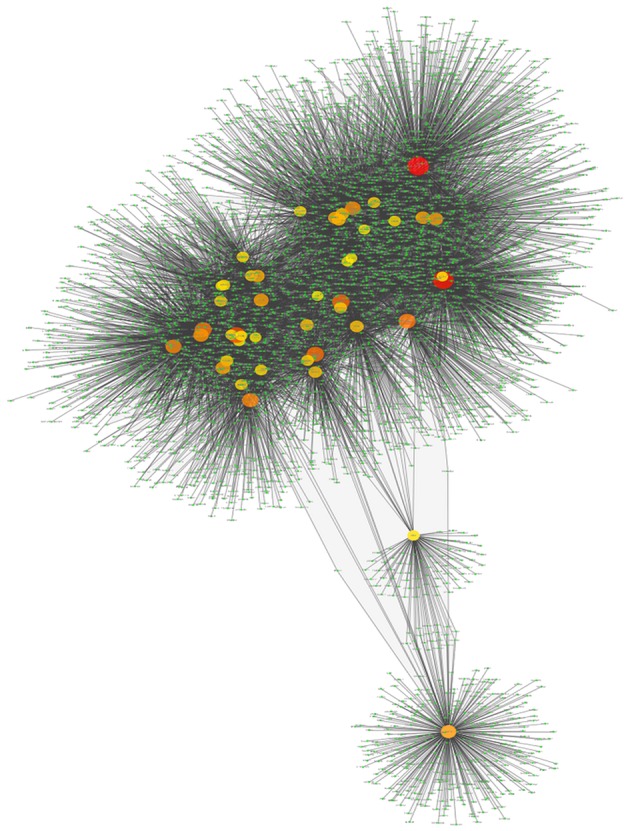
Figure 4.

Transcriptional network of TFBS interactions for the MEF2C transcription factors and its targets up to the third level. In this visualization, the color and the size of the genes is depicted according to node-degree (number of neighbors connected to this particular gene): small green nodes correspond to barely-connected genes; whereas larger orange and red nodes represent highly connected genes.
