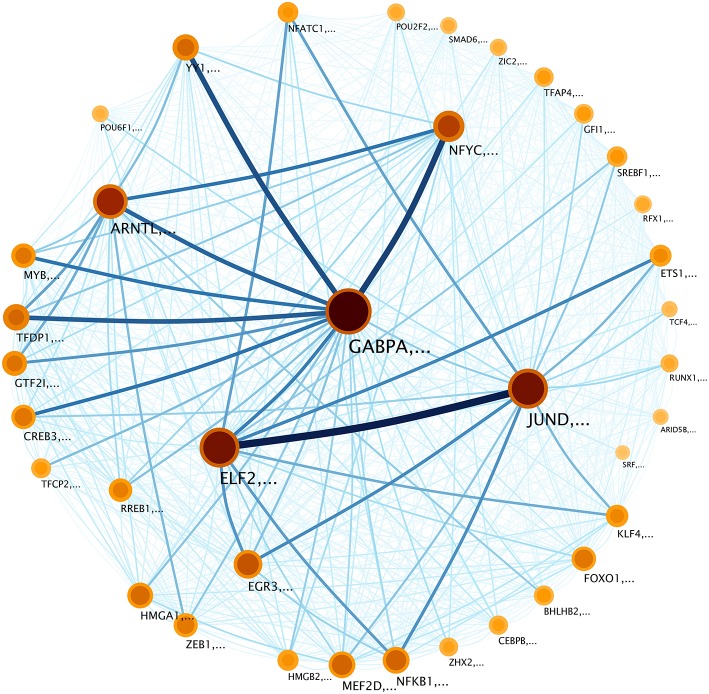
Figure 5.
Community structure of the transcriptional network in Figure 4. Modules are tagged with the name of the node whit the highest PageRank (Brin and Page, 2012) inside the community. Nodes (which represent communities) are depicted according to the size of the community and the information flow inside that community. In this sense, darker colors correspond to larger information contents whereas bigger circles represent larger communities. The relative degree of information flow is depicted in the width and color of the inter-module links. The thickness of the module borders reflects the probability that a random surfer within the module, will follow a regulation (edge) to a gene outside of the module. The weighted links between communities represent regulation flow, with the color and width of the edges indicating flow volume. For example, the lines between JUND and ELF2 communities, indicate information flow of regulation between them. These links reveal the relationship between communities.

