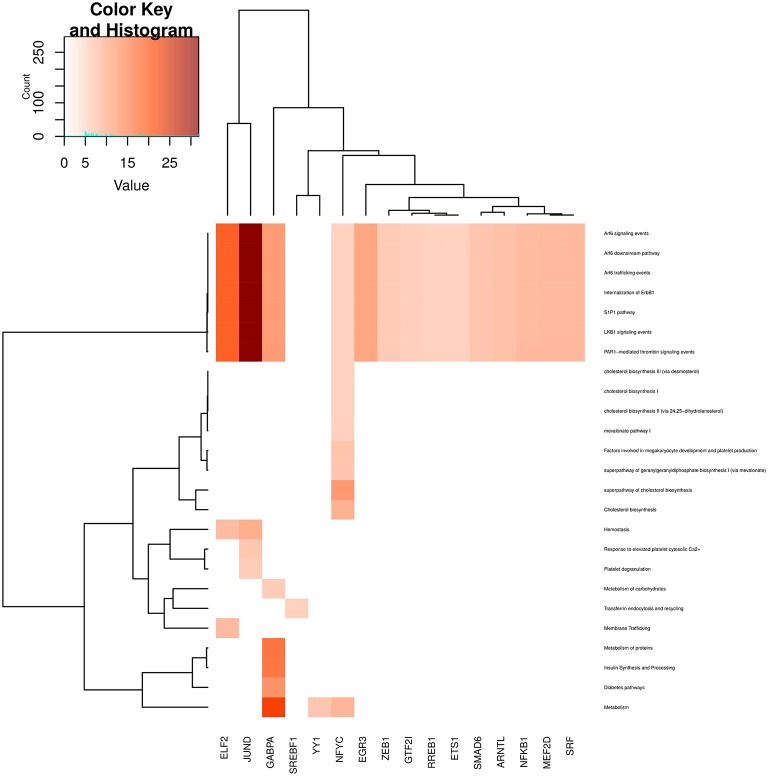
Figure 9.
Heatmap depicting enrichment in pathways related to metabolism and cellular transport processes. Communities are tagged with the name of its higher PageRank molecule. Color intensity is proportional to the −log of p-value. Darker spots correspond to statistically significant hits. The upper-left inset shows the Z-score histogram and color key for the p-value of the enriched processes. Finally, a dendrogram which shows similar p-value distributions among the enriched processes in the communities is also depicted.

