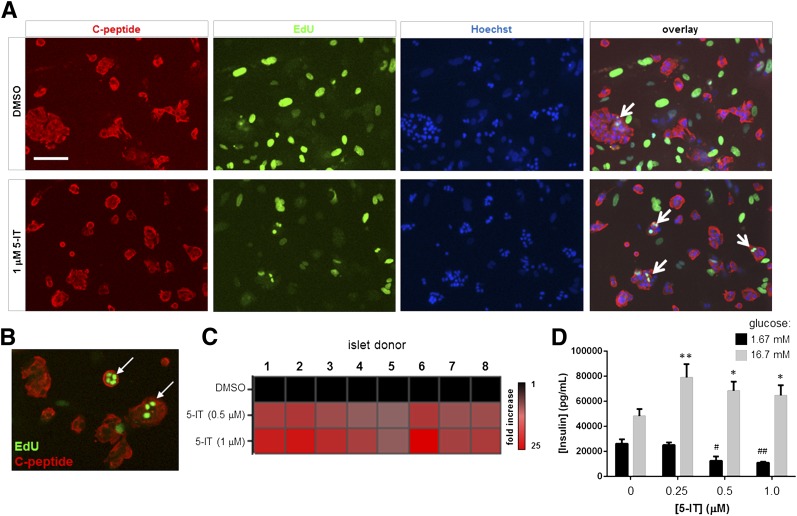
Figure 1.
Induction of human β-cell proliferation by 5-IT. A: Images showing insulin immunofluorescence and EdU incorporation in dissociated islets treated for 6 days with 1 μmol/L 5-IT. Representative EdU-positive β-cells are indicated with a white arrow. Scale bar, 100 μm. B: Higher-magnification image of EdU-positive β-cells. C: Heat map of EdU-positive β-cells in eight individual islet donors. Donor information is provided in Supplementary Fig. 2. D: GSIS after treatment of dissociated islets for 12 days with the indicated concentration of 5-IT. Cells were challenged with 1.67 mmol/L (black bars) or 16.7 mmol/L glucose (gray bars) for 1 h. Data represent the mean ± SD of four independent wells. *P < 0.01 and **P < 0.001, compared with DMSO treatment (high glucose), two-tailed Student t test. #P < 0.001, compared with DMSO treatment; ##P < 10−4, compared with DMSO treatment (low glucose), two-tailed Student t test.

