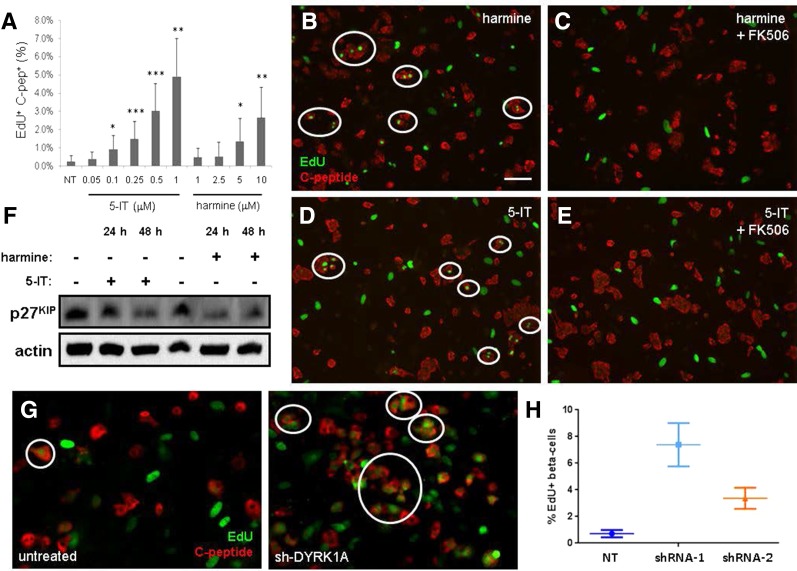
Figure 3.
DYRK1A inhibitor harmine also induces β-cell proliferation. A: Effect of 6-day treatment with indicated concentrations of 5-IT or harmine. Data represent the mean ± SD of four independent wells and nine fields of view per well. *P < 0.05, **P < 0.01, and ***P < 0.001, compared with DMSO treatment, two-tailed Student t test. C-pep, C-peptide. B: Fluorescent image of dissociated islets treated for 6 days with 10 μmol/L harmine. Scale bar, 100 μm. EdU-positive β-cells are circled in white. C: Fluorescent image of dissociated islets treated with 10 μmol/L harmine and 1 μmol/L FK506. D: Fluorescent image of dissociated islets treated for 6 days with 0.5 μmol/L 5-IT. E: Fluorescent image of dissociated islets treated with 0.5 μmol/L 5-IT and 1 μmol/L FK506. F: Western blot of p27KIP phosphorylation (S10) in INS-1E cells in response to 24- or 48-h treatment with 10 μmol/L harmine or 0.5 μmol/L 5-IT. Actin was included as a loading control. G: Fluorescent image of dissociated islets untreated (left) or infected with adenovirus expressing sh-DYRK1A (right). H: Quantification of EdU-positive β-cells in untreated islets or islets in which DYRK1A has been knocked down by two different constructs. Data represent 12 independent wells per condition, imaged at nine sites per well. Error bars represent the 95% CI of the mean. NT, untreated.

