Figure 4.
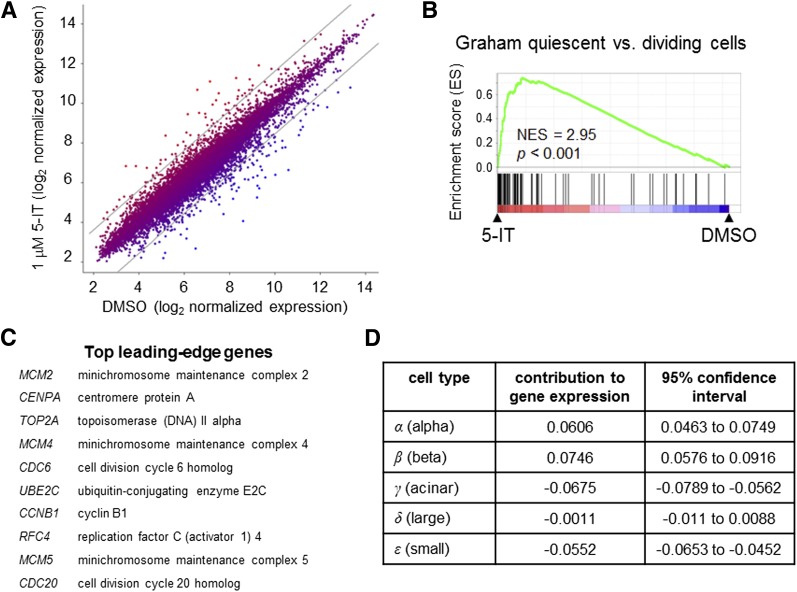
Gene expression profiling of 5-IT–treated islets consistent with increased β-cell proliferation. A: Scatter plot of gene expression results of intact islets treated for 6 days with DMSO or 1 μmol/L 5-IT, expressed as the geometric average across three donors. Gray lines show the threshold for genes with threefold increase or decrease in gene expression. B: GSEA results reveal a number of sets associated with cell division. Representative gene set analysis shown. Statistical analysis performed as previously described (23,24). C: Top leading-edge genes contributing to GSEA. D: Estimated changes in cell mass (α, β, acinar, large duct, small duct, and uncharacterized) after treatment with 5-IT, determined by five-dimensional linear regression.

